Feature Publication Archive
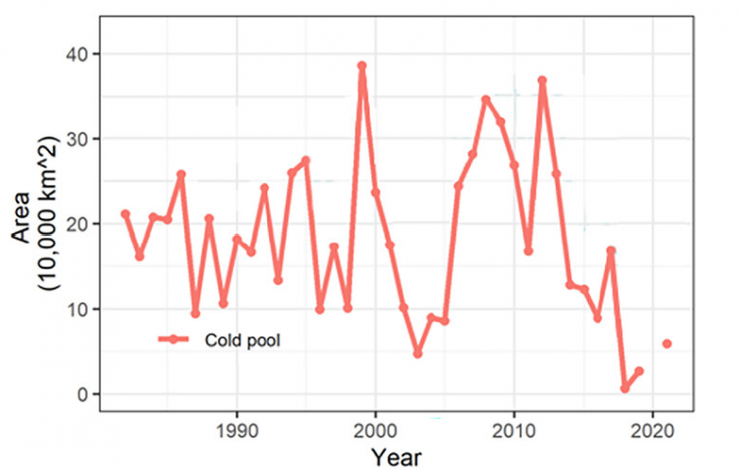
History of the Bering Sea cold pool extent based on NOAA Fishery bottom trawl surveys (note there are no data in 2020). Credit: NOAA National Marine Fisheries Service
Overland, J.E., E. Siddon, G. Sheffield, T. Ballinger, and C. Szuwalski (2024): Transformative ecological and human impacts from climate change and diminished sea ice in the northern Bering Sea. Wea. Climate Soc., 16(2), 303–313, doi: 10.1175/WCAS-D-23-0029.1, View open access article at AMS.
Unprecedentedly low sea ice cover in the northern Bering and Chukchi seas during back-to-back winters from 2018 to 2019 caused a cascade of impacts that abruptly transformed the regional marine ecosystem, compounding challenges faced by the communities that rely on it.
A new paper authored by scientists from NOAA Research, NOAA Fisheries and the University of Alaska examined how the loss of sea ice delivered an... more »
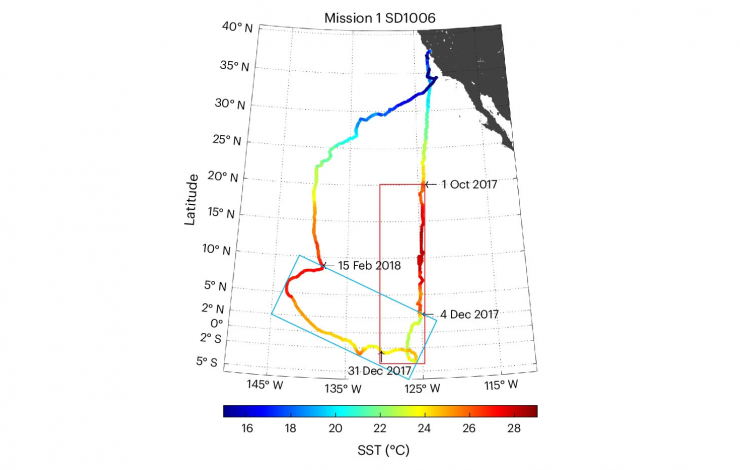
TPOS 2017 mission. Saildrone #1006 (SD1006) track, coloured by SST measured at 0.6 m.
Cronin, M.F., D. Zhang, S.M. Wills, J.E. Reeves Eyre, L.-A. Thompson, and N. Anderson (2024): Diurnal warming rectification in the tropical Pacific linked to sea surface temperature front. Nature Geosci., doi: 10.1038/s41561-024-01391-8, View open access article at Nature Publishing (external link).
Over the past 20 years, researchers have been studying how the atmosphere reacts to changing ocean temperatures globally, sparking debates on the exact mechanisms at play.
Using advanced tools like uncrewed surface vehicles (USVs), moored ocean buoys, and satellite data, a new study published in Nature Geoscience investigates how changes in ocean surface temperature affect our atmosphere's stability and movement. Focusing on the eastern Pacific Ocean near the equator, this work uncovers... more »
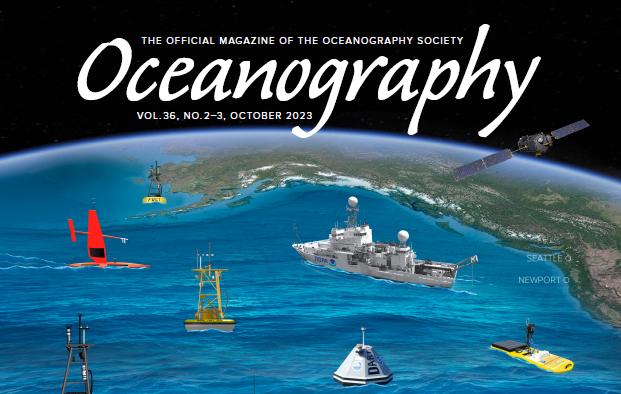
Special issue of Oceanography exploring 50 years of PMEL history and accomplishments. The cover illustration depicts many of the technologies that support research at the NOAA Pacific Marine Environmental Laboratory (PMEL). (Cover illustration with technologies identified)
Oceanography, Volume 36 (2-3) October 2023
Pacific Marine Environmental Laboratory: 50 Years of Innovative Research in Oceanography
Fifty years ago, NOAA created a new environmental research laboratory in Seattle with an initial focus on water quality in Puget Sound, and environmental studies of the Gulf of Alaska and Bering Sea.
Since then, the Pacific Marine Environmental Laboratory has evolved into one of the world's leading ocean research institutes, specializing in observing ocean conditions from tsunamis to changes in climate and ocean chemistry with the aid of innovative instrumentation and measurement strategies often developed by the lab.
To recognize PMEL's half-century of accomplishments, the... more »
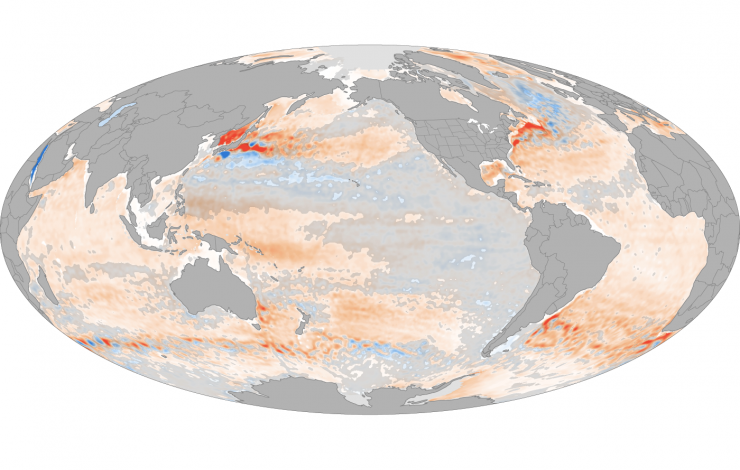
Change in heat content in the upper 2,300 feet (700 meters) of the ocean from 1993-2022. Between 1993–2022, heat content rose by up to 6 Watts per square meter in parts of the ocean (dark orange). Some areas lost heat (blue), but overall, the ocean gained more heat than it lost. The changes in areas covered with the gray shading were small relative to the range of natural variability. NOAA Climate.gov image, based on data from NCEI.
Ballinger, T.J., J.E. Overland, M. Wang, J.E. Walsh, B. Brettschneider, R.L. Thoman, U.S. Bhatt, E. Hanna, I. Hanssen-Bauer, and S.-J. Kim (2023): Surface air temperature, in State of the Climate in 2022, The Arctic. Bull. Am. Meteorol. Soc., 104(9), S279–S281, doi: 10.1175/10.1175/BAMS-D-23-0079.1, View online at AMS (external link).
Benestad, R., R.L. Thoman, Jr., J.L. Cohen, J.E. Overland, E. Hanna, G.W.K. Moore, M. Rantanen, G.N. Petersen, and M. Webster (2023): 2022 extreme weather and climate events [Sidebar 5.1] , in State of the Climate in 2022. Bull. Am. Meteorol. Soc., 104(9), S285–S287, doi: 10.1175/10.1175/BAMS-D-23-0079.1, View online at AMS (external link).
Johnson, G.C., and R. Lumpkin (2023): Overview. In State of the Climate in 2022, Global Oceans. Bull. Am. Meteorol. Soc., 104(9), S152–S153, doi: 10.1175/BAMS-D-23-0076.2, View online at AMS (external link).
Johnson, G.C., J.M. Lyman, C. Atkinson, T. Boyer, L. Cheng, J. Gilson, M. Ishii, R. Locarnini, A. Mishonov, S.G. Purkey, J. Reagan, and K. Sato (2023): Ocean heat content. In State of the Climate in 2022, Global Oceans. Bull. Am. Meteorol. Soc., 104(9), S159–S162, doi: 10.1175/BAMS-D-23-0076.2, View online at AMS (external link).
Johnson, G.C., J. Reagan, J.M. Lyman, T. Boyer, C. Schmid, and R. Locarnini (2023): Salinity. In State of the Climate in 2022, Global Oceans. Bull. Am. Meteorol. Soc., 104(9), S163–S167, doi: 10.1175/BAMS-D-23-0076.2, View online at AMS (external link).
McPhaden, M.J. (2023): The 2020-22 Triple Dip La Niña, in State of the Climate in 2022, Global Oceans [Sidebar 3.1]. Bull. Am. Meteorol. Soc., 104(9), S157–S158, doi: 10.1175/BAMS-D-23-0076.2, View online at AMS (external link).
Sharp, J. (2023): Tracking global ocean oxygen content, in State of the Climate in 2022, Global Oceans [Sidebar 3.2]. Bull. Am. Meteorol. Soc., 104(9), S189–S190, doi: 10.1175/BAMS-D-23-0076.2, View online at AMS (external link).
Wanninkhof, R., J.A. Triñanes, P. Landschützer, R.A. Feely, and B.R. Carter (2023): Global ocean carbon cycle. In State of the Climate in 2022, Global Oceans. Bull. Am. Meteorol. Soc., 104(9), S191–S195, doi: 10.1175/BAMS-D-23-0076.2, View online at AMS (external link).
Wen, C., P.W. Stackhouse, J. Garg, P.P. Xie, L. Zhang, and M.F. Cronin (2023): Global ocean heat, freshwater, and momentum fluxes, in State of the Climate in 2022. Bull. Am. Meteorol. Soc., 104(9), S168–S172, doi: 10.1175/BAMS-D-23-0076.2, View online at AMS (external link).
The year 2022 was marked by unusual (though not unprecedented) disruptions in the climate system including a “triple-dip” La Niña nearly continuous from August 2020 through the end of 2022, extraordinary amount of precipitation over Antarctica in 2022 and the Hunga Tonga–Hunga Ha’apai underwater volcano eruption in January. Greenhouse gas concentrations, global sea... more »
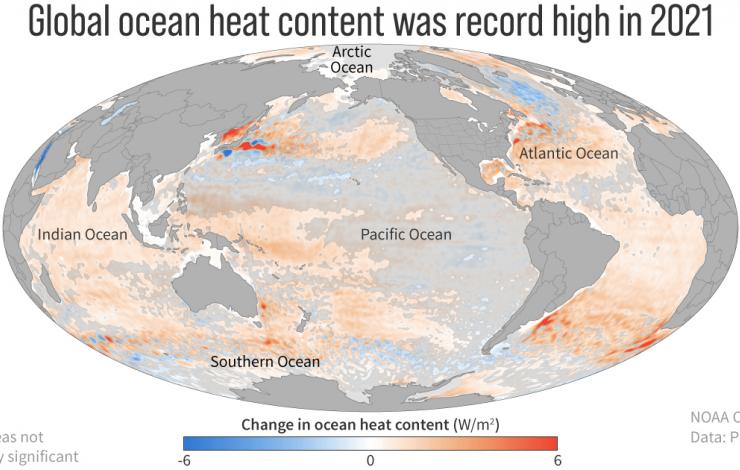
Most of the excess energy being trapped in the Earth system by increasing amounts of greenhouse gases is stored in the ocean. This map shows where the global ocean gained (orange) or lost (blue) energy between 1993 and 2021. Places where the trend is small relative to year-to-year variability (not statistically significant) are shaded with gray. NOAA Climate.gov map, based on data provided by John Lyman.
Ballinger, T.J., J.E. Overland, R.L. Thoman, M. Wang, M.A. Webster, L.N. Boisvert, C.L. Parker, U.S. Bhatt, B. Brettschneider, E. Hanna, I. Hanssen-Bauer, S.-J. Kim, and J.E. Walsh (2022). Surface air temperature, in State of the Climate in 2021, The Arctic. Bull. Am. Meteorol. Soc., 103(8), S264–S267.
Meier, W. N., D. Perovich, S. Farrell, C. Haas, S. Hendricks, A. Petty, M. Webster, D. Divine, S. Gerland, L. Kaleschke, R. Ricker, A. Steer, X. Tian-Kunze, M. Tschudi, and K. Wood (2022). Sea ice, in State of the Climate in 2021”, The Arctic. Bull. Amer. Meteor. Soc., 103 (8), S270–S273.
Feely, R.A., and R. Wanninkhof (2022). Sidebar: IPCC AR6 Assessment of the role of the oceans in the carbon cycle. In State of the Climate in 2021, Global Oceans. Bull. Am. Meteorol. Soc., 103(8), S178-S179.
Johnson, G.C., and R. Lumpkin (2022). Overview. In State of the Climate in 2021, Global Oceans. Bull. Am. Meteorol. Soc., 103(8), S149.
Johnson, G.C., J.M. Lyman, T. Boyer, L. Cheng, J. Gilson, M. Ishii, R.E. Killick, and S.G. Purkey (2022). Ocean heat content. In State of the Climate in 2021, Global Oceans. Bull. Am. Meteorol. Soc., 103(8), S153-S157.
Johnson, G.C., J. Reagan, J.M. Lyman, T. Boyer, C. Schmid, and R. Locarnini (2022). Salinity. In State of the Climate in 2021, Global Oceans. Bull. Am. Meteorol. Soc., 103(8), S157-S162.
Greenhouse gas concentrations, global sea levels and ocean heat content reached record highs in 2021, according to the 32nd annual State of the Climate report, despite a double-dip La Niña event taking place in the Pacific Ocean.
Ocean climate change,
varies with La Niña, yet, ... more »


