Feature Publication Archive
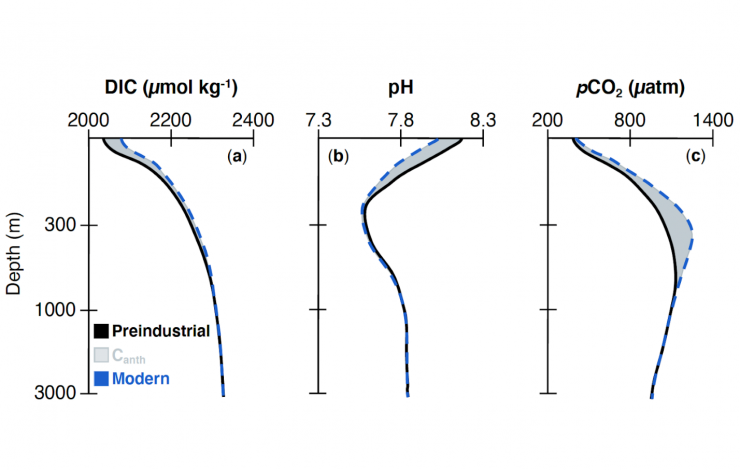
The modern ocean (blue dashed profiles) reflects the combination of natural, preindustrial conditions (black profiles) and human-induced changes (gray shading). (a) Dissolved inorganic carbon (DIC; µmol kg-1) has increased most near the surface where the ocean absorbs CO2 from the atmosphere. This has caused measurable and distinct changes in (b) pH and (c) pCO2 (µatm). Click on image to enlarge.
Arroyo, M.C., A.J. Fassbender, B.R. Carter, C.A. Edwards, J. Fiechter, A. Norgaard, and R.A. Feely (2022): Dissimilar sensitivities of ocean acidification metrics to anthropogenic carbon accumulation in the Central North Pacific Ocean and California Current Large Marine Ecosystem. Geophys. Res. Lett., 49(15), e2022GL097835, doi: 10.1029/2022GL097835, View online (open access).
The ocean plays a key role in mitigating climate change by absorbing about 25 percent of the carbon dioxide gas (CO2) released into the atmosphere each year by human activities. However, this comes at a cost to ocean health because the uptake of this human-released carbon causes changes in ocean chemistry, called ocean acidification (OA), that can be detrimental to marine ecosystems.
A University of California - Santa Cruz (UCSC) and NOAA led research team set out to understand how OA metrics, such as pH and the partial pressure of CO2 (pCO2), have changed below... more »
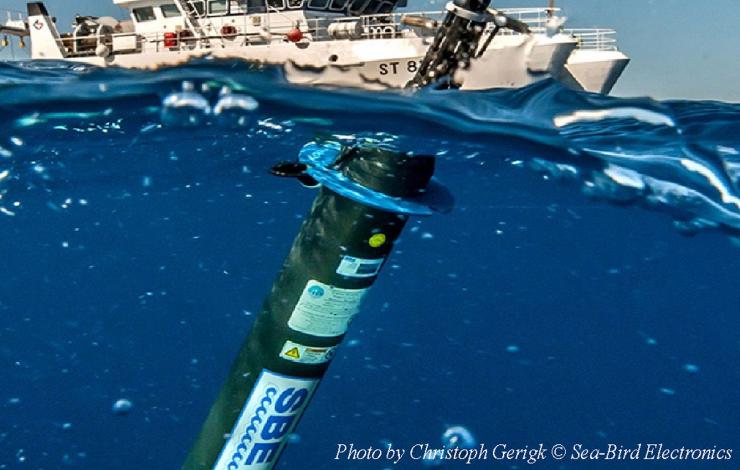
Biogeochemical (BGC) profiling floats are free-drifting, battery-powered platforms that measure up to six BGC parameters: pH, oxygen, nitrate, chlorophyll a, suspended particles, and downwelling irradiance. BGC floats typically profile from 2000 meters to the surface every 10 days and operate for 4 to 6 years, contributing significantly to the global ocean observing system. Photo by Christoph Gerigk/Sea-Bird Electronics
Huang, Y., Fassbender, A. J., Long, J. S., Johannessen, S., & Bernardi Bif, M. (2022). Partitioning the export of distinct biogenic carbon pools in the Northeast Pacific Ocean using a biogeochemical profiling float. Global Biogeochemical Cycles, 36, e2021GB007178. https://doi.org/10.1029/2021GB007178
Microscopic organisms in the surface ocean, called phytoplankton, use photosynthesis to convert carbon dioxide into organic compounds like carbohydrates, fats, and proteins. Only a small fraction of this organic matter produced by phytoplankton is transferred (exported) to deeper layers of the ocean, either through sinking particles (a more efficient process) or downward mixing of dissolved carbon (a less efficient process). Characterizing the export of these carbon pools over time and space, and how it might be changing, is required to understand marine ecosystem functioning and to... more »
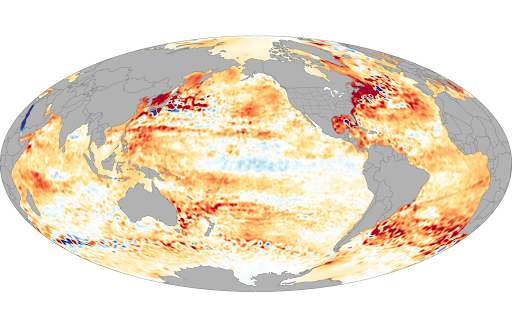
This map shows heat content anomalies (differences from the long-term average)—in the top 700 meters (~2,100 feet) of the global ocean. Positive anomalies mean the ocean gained heat in 2020 (orange); negative anomalies mean the ocean lost heat energy (blue) in 2020. NOAA Climate.gov image, based on data provided by John Lyman (UH JIMAR/PMEL)
Johnson, G.C., and R. Lumpkin (2021): Overview. In State of the Climate in 2020, Global Oceans. Bull. Am. Meteorol. Soc., 102 (8), S149–S150, https://doi.org/10.1175/ BAMS-D-21-0083.1.
Johnson, G.C., J.M. Lyman, T. Boyer, L. Cheng, J. Gilson, M. Ishii, R.E. Killick, and S.G. Purkey (2021): Ocean heat content. In State of the Climate in 2020, Global Oceans. Bull. Am. Meteorol. Soc., 102 (8), S156–S159, https://doi.org/10.1175/ BAMS-D-21-0083.1.
Johnson, G.C., J. Reagan, J.M. Lyman, T. Boyer, C. Schmid, and R. Locarnini (2021): Salinity. In State of the Climate in 2020, Global Oceans. Bull. Am. Meteorol. Soc., 102 (8), S159–S164, https://doi.org/10.1175/ BAMS-D-21-0083.1.
Alin, S.R., A.U. Collins, B.R. Carter, and R.A. Feely (2021): Ocean acidification status in Pacific Ocean surface seawater in 2020. In State of the Climate in 2020, Global Oceans. Bull. Am. Meteorol. Soc., 102 (8), S184–S185, https://doi.org/10.1175/ BAMS-D-21-0083.1.
Feely, R.A., R. Wanninkhof, P. Landschützer, B.R. Carter, J.A. Triñanes, and C. Cosca (2021): Global ocean carbon cycle. In State of the Climate in 2020, Global Oceans. Bull. Am. Meteorol. Soc., 102 (8), S185–S190, https://doi.org/10.1175/ BAMS-D-21-0083.1.
Tamsitt, V., S. Bushinsky, Z. Li, M. du Plessis, A. Foppert, S. Gille, S. Rintoul, E. Shadwick, A. Silvano, A. Sutton, S. Swart, B. Tilbrook, and N.L. Williams (2021): Southern Ocean. In State of the Climate in 2020. Bull. Am. Meteorol. Soc., 102 (8), S341–S345, https://doi.org/10.1175/BAMS-D-21-0081.1.
The 31st annual State of the Climate report confirmed that several markers such as sea level, ocean heat content, and permafrost in 2020 once again broke records set just one year prior. 2020 was also among the three warmest years in records dating to the mid-1800s, even with a cooling La Niña influence in the second half of the year. New high temperature records were set across the globe.
The report found that the major... more »
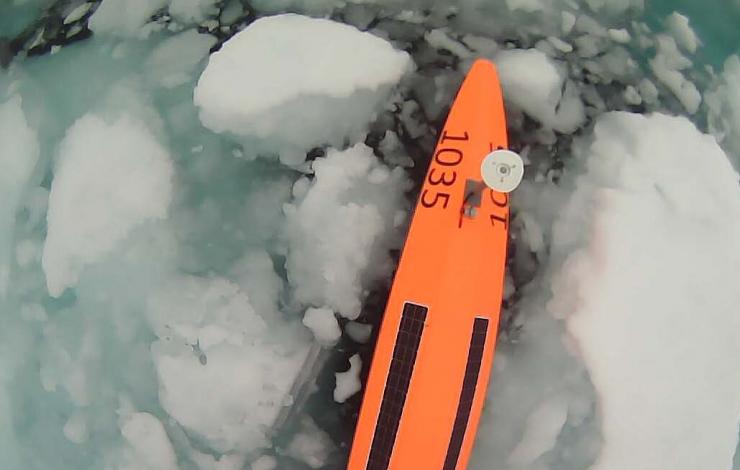
Downward-looking image taken atop the saildrone wing while in sea ice in 2019 mission (Photo Credit: Saildrone Inc.)
Chiodi AM, Zhang C, Cokelet ED, Yang Q, Mordy CW, Gentemann CL, Cross JN, Lawrence-Slavas N, Meinig C, Steele M, Harrison DE, Stabeno PJ, Tabisola HM, Zhang D, Burger EF, O’Brien KM and Wang M (2021) Exploring the Pacific Arctic Seasonal Ice Zone With Saildrone USVs. Front. Mar. Sci. 8:640690. doi: 10.3389/fmars.2021.640697
A recent study published in Frontiers in Marine Science identified navigational challenges and opportunities for Arctic study using saildrones. Researchers from NOAA and other affiliates were among those carrying out the mission, where they took five saildrones to the US Arctic to test their remote navigation capabilities in close proximity to ice, while also collecting data to advance our understanding of Arctic weather, climate, and ecosystems. They then compared existing methods and products for remote sea ice... more »
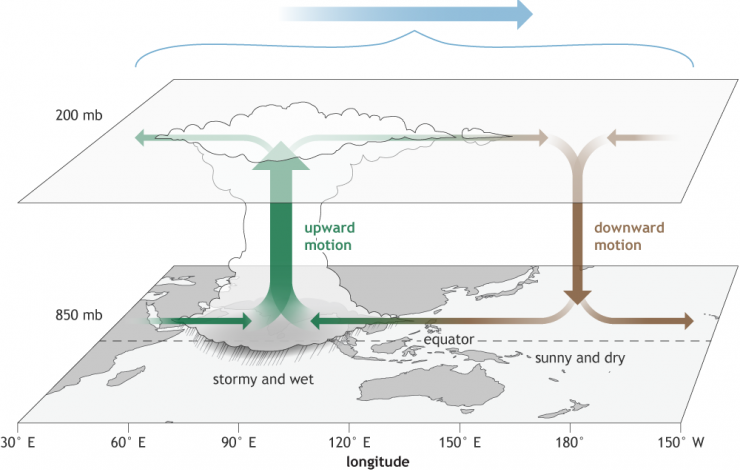
MJO Schematic showing the eastward moving disturbance of clouds, rainfall, winds, and pressure that circles the planet in the tropics and returns to its points of origin in 30 to 60 days, on average. Read the full description on climate.gov.
Zhang, C. (PMEL), A. Adames, B. Khouidar, B. Wang, and D. Yang (2020): Four theories of the Madden-Julian Oscillation. Rev. Geophys., 58(3), e2019RG000685. https://doi.org/10.1029/2019RG000685
The Madden-Julian Oscillation (MJO) is the leading intraseasonal (20–100 days) variability in the tropics. It affects many weather-climate phenomena globally. Tremendous progress has been made in observing, describing, simulating, understanding, and forecasting the MJO since its first documentation in the early 1970s. In particular, theoretical understanding of the MJO has flourished during the past decade or two, with very diverse ideas on the fundamental components of MJO dynamics.


