Feature Publication Archive

A researcher with the Pacific Northwest National Laboratory collects samples from Sequim Bay, Washington that will be analyzed for total alkalinity and dissolved inorganic carbon measurements during the February 2025 alkalinity release experiment. Credit: Nick Ward, PNNL
Savoie, A.M., M. Ringham, C. Torres Sanchez, B.R. Carter, S. Dougherty, R.A. Feely, D. Hegeman, J. Herndon, T. Khangaonkar, J. Loretz, T. Minck, T. Pelman, L. Premathilake, C. Subban, J. Vance, and N.D. Ward (2025): Novel field trial for ocean alkalinity enhancement using electrochemically derived aqueous alkalinity. Front. Environ. Eng., 4, 1641277, doi: 10.3389/fenve.2025.1641277.
Carefully enhanced wastewater could one day benefit coastal marine resources
The continual rise of carbon dioxide in the atmosphere isn't just changing weather patterns, it's also silently altering the chemistry of the global ocean. As CO2 dissolves into seawater, it forms carbonic acid, driving down ocean pH in a process known as ocean acidification. This fundamental shift threatens... more »

CCE2, a biogeochemical buoy, is positioned on the deck of the R/V Sally Ride before deployment shelf break off of Point Conception on the California Coast, where localized upwelling processes are at their maximum. Credit: Wills Moore, Scripps Institution of Oceanography.
Frazão, H.C., U. Send, A.J. Sutton, M.D. Ohman, M. Lankhorst, T.R. Martz, and J. Sevadjian (2025). Open ocean versus upwelling regimes: Air-sea CO2 fluxes and pCO2 inter-annual variability in the Southern California Current System. J. Geophys. Res. Oceans, 130(7), e2024JC022126. https://doi.org/10.1029/2024JC022126
Song, R., T. DeVries, R. Li, A.J. Sutton, U. Send, and H.C. Frazão (2025). High-frequency correlations between winds and pCO2 change the California Coastal Upwelling System from a CO2 sink to a source. Geophys. Res. Lett., 52(14), e2025GL115470. https://doi.org/10.1029/2025GL115470
Surprising findings from a pair of NOAA buoys show the importance of frequent, long-term observations
While the global ocean has long been recognized as a crucial carbon sink, quantifying the exchange of carbon dioxide (CO2) between the ocean and atmosphere has become one of the most daunting challenges in Earth science. Researchers have labored for decades to capture observations that would help them understand with greater precision how different ocean regions absorb or release carbon.
A pair of recent studies focused on the California Current Ecosystem... more »

Uncrewed Surface Vessels, like this Saildrone, offer a cost-effective way to greatly increase ocean observations. Credit: Saildrone.
Patterson, R.G., M.F. Cronin, S. Swart, J. Beja, J.M. Edholm, J. McKenna, J.B. Palter, A. Parker, C.I. Addey, W. Boone, P. Bhuyan, J.J.H. Buck, E.F. Burger, J. Burris, L. Camus, B. de Young, M. du Plessis, M. Flanigan, G.R. Foltz, S.T. Gille, L. Grare, J.E. Hanson, L.R. Hole, M.C. Honda, V. Hormann, C. Kohlman, N. Kosaka, C. Kuhn, L. Lenain, L. Looney, A. Marouchos, E.K. McGeorge, C.R. McMahon, S. Mitarai, C. Mordy, A. Nagano, S.-A. Nicholson, S. Nickford, K.M. O'Brien, D. Peddie, L. Ponsoni, V. Ramasco, N. Rozenauers, E. Siddle, C. Stienbarger, A.J. Sutton, N. Tada, J. Thomson, I. Ueki, L. Yu, C. Zhang, and D. Zhang (2025): Uncrewed surface vehicles in the Global Ocean Observing System: A new frontier for observing and monitoring at the air-sea interface. Front. Mar. Sci., 12, 1523585, doi: 10.3389/fmars.2025.1523585.
The global ocean covers 71% of the planet. Across these vast spaces, interactions between the ocean and atmosphere are primary drivers of Earth's weather, climate and marine productivity.
Satellites, instrumented moorings, and infrequent ship-borne research missions have revealed much about these interactions, but large areas of the ocean are significantly undersampled.
To fill in the gaps, scientists have increasingly turned to an array of Uncrewed Surface Vehicles (USV), some of which can navigate tens of thousands of kilometres to capture key observations autonomously.... more »

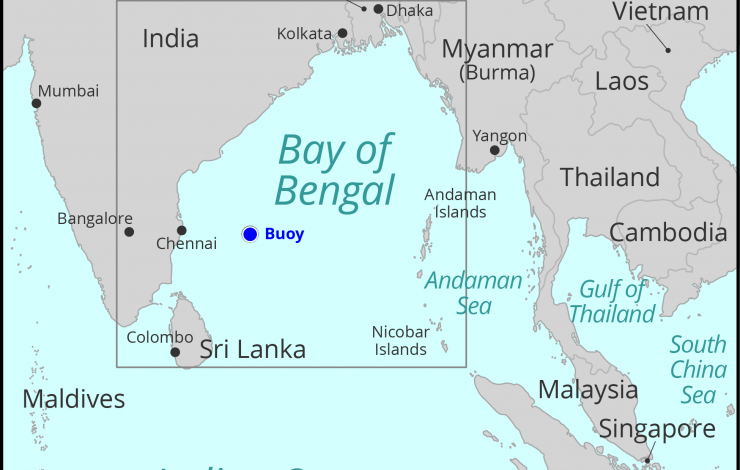
The Bay of Bengal, with the location of the instrumented buoy shown by the blue dot. Credit Sarah Battle, NOAA PMEL
McPhaden, M.J., K. Athulya, M.S. Girishkumar, and M. Orlic (2024): Ekman revisited: Surface currents to the left of the winds in the Northern Hemisphere. Sci. Adv., 10(46), eadr0282, doi: 10.1126/sciadv.adr0282.
Rare observations of surface currents to the left of winds in the Bay of Bengal
One of the foundational principles of modern oceanography is that ocean surface currents on our rotating planet will be deflected to the right of the winds in the Northern Hemisphere and to the left of the winds in the Southern Hemisphere.
While this principle, first explained by the Swedish oceanographer Vagn Walfrid Ekman in 1905, applies everywhere on Earth, there's more to the story, including a twist described in new research by an international team led by a scientist with NOAA's... more »

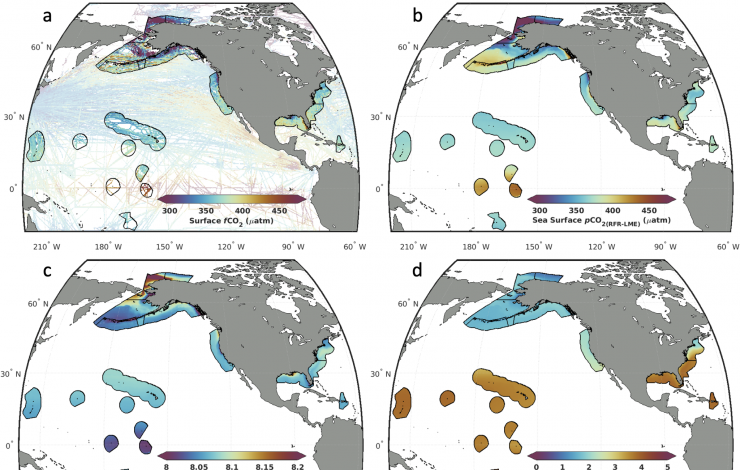
(a) Long-term averages (1998-2022) of surface ocean CO2 fugacity observations from SOCATv2023, binned into 0.25° × 0.25° monthly grid cells, which are used in the development of RFR-LMEs. (b-d) Long-term averages (1998-2022) of monthly RFR-LME maps of surface ocean (b) CO2 partial pressure, (c) pH on the total scale, and (d) calcium carbonate saturation state with respect to aragonite.
Sharp, J.D., L.-Q. Jiang, B.R. Carter, P.D. Lavin, H.L. Yoo, and S. Cross (2024): A mapped dataset of surface ocean acidification indicators in large marine ecosystems of the United States. Sci. Data, 11, 715, doi: 10.1038/s41597-024-03530-7.
Humans generate about 36 billion tons of carbon dioxide pollution every year, about 30 percent of which are absorbed by the oceans. While that means there's less carbon dioxide (CO2) heating the atmosphere, the result is that the chemistry of the ocean is changing in profound and damaging ways, especially for marine organisms that grow hard shells.
Now, scientists from NOAA and two cooperative institutes have developed spatially and temporally consistent maps of ocean acidification indicators covering U.S. large marine ecosystems (LME) from 1998 to 2022. The work was led... more »


