What's New Archive
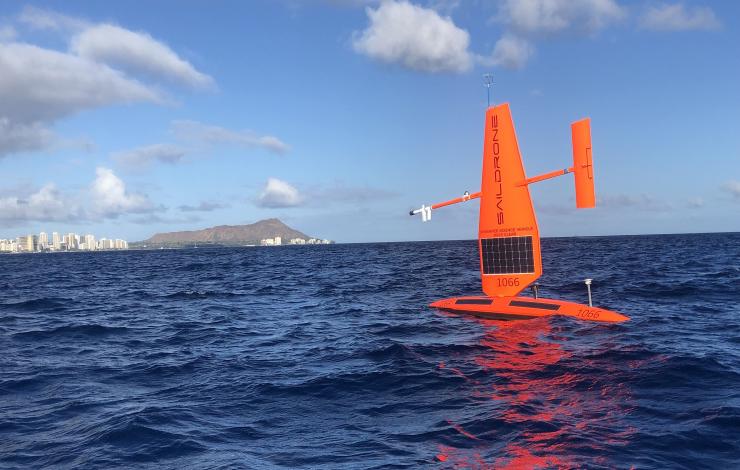
Saildrone uncrewed surface vehicles (USVs), like the one pictured here, made measurements of atmospheric cold pools in remote regions of the tropical Pacific. Credit: Saildrone, Inc.
Atmospheric cold pools over the tropical oceans produce large changes in air temperature and wind speed in the planetary boundary layer. But how they affect the larger atmospheric circulation is not clear. Cold pools are pockets of air cooler than the surrounding environment that form when rain evaporates under thunderstorms. These relatively dense air masses, ranging between 10 to 200 kilometers in diameter, lead to downdrafts that, upon hitting the ocean surface, produce temperature fronts and strong winds that impact the surrounding environment. To understand the role of cold pools in tropical convection, scientists need detailed measurements of these events; however, observations in hard-to-reach ocean locations have been lacking.
Uncrewed surface vehicles, or USVs, could be a solution. In a new study published in Geophysical Research Letters, scientists from the University of Washington and NOAA’s Pacific Marine Environmental Laboratory describe the use of Saildrone USVs, wind-propelled sailing drones with a tall, hard wing and solar-powered scientific instruments. Over three multi-month missions between 2017-2019, ten USVs covered over 137,000 kilometers and made measurements of over 300 cold pool events, defined as temperature drops of at least 1.5 degrees Celsius in 10 minutes. In one case, four USVs separated by several kilometers captured the minute-by-minute evolution of an event and revealed how the cold pool propagated across the region.
The Saildrone USVs measured variations in air temperature, wind speed, humidity, pressure, and sea surface temperature and salinity. Analysis of these variables revealed key features of cold pool events, including how much and how quickly air temperatures dropped, how long it took for wind speeds to reach their peaks, and the dynamics of sea surface temperature changes. The results can be used to evaluate mathematical models of tropical convection and explore more questions, like how gusts at cold pool fronts affect air-sea heat fluxes.
These missions are part of a larger effort to enhance the Tropical Pacific Observing System (TPOS) to improve long-term weather forecasts and better understand local and regional implications of global phenomena such as El Niño Southern Oscillation (ENSO), hurricanes, typhoons and marine heatwaves (e.g. the “Blob”). An international team of scientists are working to rethink and refine the TPOS to build a more effective, modern and robust observing system to meet the observational, experimental, and operational needs of today and the future.
Story modified from Eos Original Story posted on July 6, 2021.
CLICK IMAGE TO ANIMATE: Comparison of overlapping one-year estimates at 6-month intervals of net top-of-the-atmosphere annual energy flux from CERES (solid orange line) and an in situ observational estimate of uptake of energy by Earth climate system (solid turquoise line). Credits: NASA/Tim Marvel
NOAA and NASA researchers have found that Earth’s energy imbalance approximately doubled during the 14-year period from 2005 to 2019. Earth's climate is determined by a delicate balance between how much of the Sun's radiative energy is absorbed in the atmosphere and at the surface and how much thermal infrared radiation Earth emits to space. A positive energy imbalance means the Earth system is gaining energy, causing the planet to heat up. The doubling of the energy imbalance is the topic of a recent study, the results of which were published June 15 in Geophysical Research Letters.
Scientists compared data from two independent measurements. NASA's Clouds and the Earth's Radiant Energy System (CERES) suite of satellite sensors measure how much energy enters and leaves Earth's system. In addition, data from a global array of ocean floats, called Argo, enable an accurate estimate of the rate at which the world’s oceans are heating up. Since approximately 90 percent of the excess energy from an energy imbalance ends up in the ocean, the overall trends of incoming and outgoing radiation should broadly agree with changes in ocean heat content.
"The two very independent ways of looking at changes in Earth's energy imbalance are in really, really good agreement, and they're both showing this very large trend, which gives us a lot of confidence that what we're seeing is a real phenomenon and not just an instrumental artifact, " said Norman Loeb, lead author for the study and principal investigator for CERES at NASA's Langley Research Center in Hampton, Virginia. "The trends we found were quite alarming in a sense."
Increases in emissions of greenhouse gases such as carbon dioxide and methane due to human activity trap heat in the atmosphere, capturing outgoing radiation that would otherwise escape into space. The warming drives other changes, such as snow and ice melt, and increased water vapor and cloud changes that can further enhance the warming. Earth’s energy imbalance is the net effect of all these factors. In order to determine the primary factors driving the imbalance, the investigators used a method that looked at changes in clouds, water vapor, combined contributions from trace gases and the output of light from the Sun, surface albedo (the amount of light reflected by the Earth's surface), tiny atmospheric particles called aerosols, and changes in surface and atmospheric temperature distributions.
The study finds that the doubling of the imbalance is partially the result an increase in greenhouse gases due to human activity, also known as anthropogenic forcing, along with increases in water vapor are trapping more outgoing longwave radiation, further contributing to Earth’s energy imbalance. Additionally, the related decrease in clouds and sea ice lead to more absorption of solar energy.
The researchers also found that a flip of the Pacific Decadal Oscillation (PDO) from a cool phase to a warm phase likely played a major role in the intensification of the energy imbalance. The PDO is a pattern of Pacific climate variability. Its fingerprint includes a massive wedge of water in the eastern Pacific that goes through cool and warm phases. This naturally occurring internal variability in the Earth system can have far-reaching effects on weather and climate. An intensely warm PDO phase that began around 2014 and continued until 2020 caused a widespread reduction in cloud coverage over the ocean and a corresponding increase in the absorption of solar radiation.
"It's likely a mix of anthropogenic forcing and internal variability," said Loeb. "And over this period they're both causing warming, which leads to a fairly large change in Earth's energy imbalance. The magnitude of the increase is unprecedented."
Loeb cautions that the study is only a snapshot relative to long-term climate change, and that it's not possible to predict with any certainty what the coming decades might look like for the balance of Earth's energy budget. The study does conclude, however, that unless the rate of heat uptake subsides, greater changes in climate than are already occurring should be expected.
"The lengthening and highly complementary records from Argo and CERES have allowed us both to pin down Earth’s energy imbalance with increasing accuracy, and to study its variations and trends with increasing insight, as time goes on." said Gregory Johnson, co-author on the study and physical oceanographer at the National Oceanic and Atmospheric Administration's Pacific Marine Environmental Laboratory in Seattle, Washington. "Observing the magnitude and variations of this energy imbalance are vital to understanding Earth’s changing climate."
Read the original articles posted by NASA Langley.
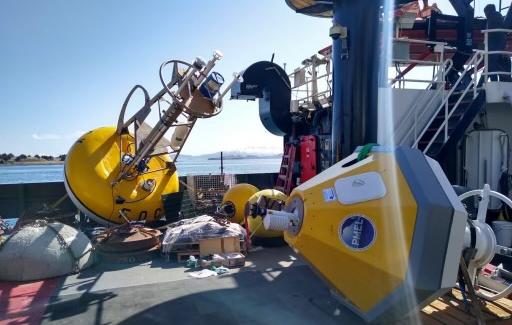
These moorings will be deployed in the Bering Sea as part of an array that collects near-continuous, year-round measurements to better understand the mechanisms and changes in a highly productive ecosystem to support sustainable management of living marine resources.
The EcoFOCI spring mooring cruise departed on the NOAA Ship Oscar Dyson on May 1, from Kodiak, AK for an annual survey that was missed in 2020 due to the COVID-19 pandemic. Scientists from NOAA’s PMEL, University of Washington Cooperative Institute for Climate, Ocean and Ecosystem Studies (CICOES) and NOAA’s Alaska Fisheries Science Center will service a biophysical mooring array in the Bering Sea, collect conductivity, temperautre, depth (CTD) profiles, zooplankton and ichthyoplankton samples and conduct special projects related to harmful algal blooms and zooplankton machine learning. Results from these observations and experiments will help describe important ecosystem linkages among climate, plankton, fishes, birds and mammals. Continuous monitoring in this region provides critical data to support sustainable management of living resources in the Bering Sea and the rapidly changing US Arctic ecosystem.
The M2 surface mooring has been deployed each spring in the southeastern Bering Sea for over 25 years and provides year-round measurements of temperature, salinity, nitrite, chlorophyll, and currents in this highly productive area. Carbon dioxide measurements taken from M2 reached another milestone of 10 years collecting data. Long-term time-series at this site are a critical tool for adapting to climate change and guiding sustainable management of living resources in the Bering Sea.
EcoFOCI will also be field testing and using several technologies in collaboration with the Innovative Technology for Arctic Exploration program including pop-up floats and remote access sampler. These technologies enhance shipboard and mooring research with more data collection over a fine scale region.
This is one of 5 research cruises the program will either lead or participate in from March-October. Geoff Lebon from UW CICOES is the Chief Scientist on the cruise. The EcoFOCI program is a collaborative research effort by scientists at NOAA's Pacific Marine Environmental Laboratory (PMEL) and Alaska Fisheries Science Center (AFSC) focusing on the unique and economically important high-latitude ecosystems of Alaska.
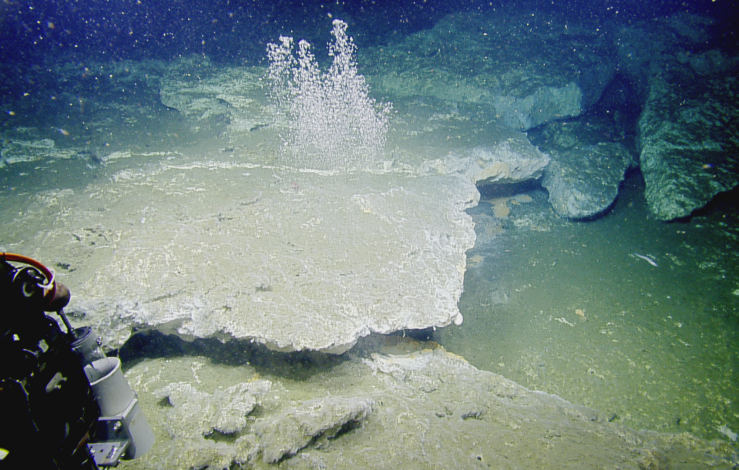
Klamath Knoll is a carbonate-capped accretionary ridge offshore southern Oregon. Bubble streams are extruding from beneath a carbonate shelf in 730 meter (2395 feet) water depth. These carbonate platforms are essential habitat for fish, deep-sea corals and invertebrates.
The U.S. West Coast continental shelf is known to host methane bubble streams, formerly thought to be rare. However, results of a recently published paper indicate that nearly 3,500 methane bubble streams, clustered into more than 1,300 methane emission sites, emanate from the seafloor from the Strait of Juan de Fuca in the north to the Mendocino Fracture Zone off northern California in the south, in an area known as the Cascadia Margin. Derived from data collected during multibeam mapping surveys on Ocean Exploration Trust's Exploration Vessel (E/V) Nautilus, the University of Washington's Research Vessel (R/V) Thompson, NOAA Ship Rainier and historical data, the discovery sheds new light on the extent and distribution of seafloor methane seeps. These seeps may provide important habitat for marine life and could play an important role in ocean warming.
The results, published in Frontiers of Earth Science by scientists from the Oregon State University-NOAA Cooperative Institute for Marine Resources Studies (CIMRS) with PMEL's Earth-Ocean Interactions Program, University of Washington, U.S. Naval Research Lab at Stennis Space Center, and Ocean Exploration Trust, provide a major contribution to the first systematic “baseline” survey of methane seeps published over such a large area, representing over 40% of the 93,000 square kilometers (35,900 square miles) of the U.S. Cascadia margin.
Until recently, the number and distribution of methane seep sites in the northeast Pacific across depth and latitude was very poorly known, with previous estimates of methane seeps, based largely on historical fisheries survey data, suggesting about a thousand seeps existed along the U.S. Cascadia Margin.
In the Frontiers of Earth Science paper, scientists present the analyses of detailed seafloor and co-registered acoustic water column data from eight large-scale multibeam sonar surveys on the U.S. Cascadia Margin with previous historical data. The analyses resulted in a remarkably detailed view of where the 3,500 bubble streams (clustered into 1,300 methane emission sites) are located as well as the seafloor features associated with the seeps.
The methane sites are concentrated in water depths less than 800 meters (2,625 feet), although sites are also found in water as deep as 2,070 meters (6,790 feet) and as shallow as 40 meters (130 feet). In waters along the Cascadia Margin, methane hydrate is stable at depths greater than about 500 meters (1,640 feet) and is unstable at shallower depths.
The importance of these methane seeps goes beyond the numbers. These seeps host chemosynthetic communities, build rocky carbonate hard grounds that are essential fish habitat, and release an unknown quantity of methane to the ocean and potentially to the atmosphere, where it acts as a powerful greenhouse gas. This new seep compilation provides a baseline to evaluate possible future increasing methane gas flux as ocean waters warm and drive what is known as the methane hydrate stability zone deeper, releasing additional methane from its ice-like form.
As methane seeps are likely ubiquitous on most or all continental margins, this study literally provides a map for more detailed studies of the ecological importance of methane seeps along the west coast of the United States.
The database of all the combined methane bubble streams and clustered emission sites is publicly available on PMEL Earth Ocean Interaction Program website
What’s next:
This summer and fall, some of the co-authors and other members of NOAA PMEL, University of Washington, and Oregon State University will participate in another Nautilus Cascadia Margin expedition as well as in the West Coast Ocean Acidification expedition aboard NOAA Ship Ron Brown. More data will be acquired for addition to this new database in order to better understand any potential impacts of methane seeps in the water column and to test new technologies.
Originally posted on NOAA Ocean Exploration.
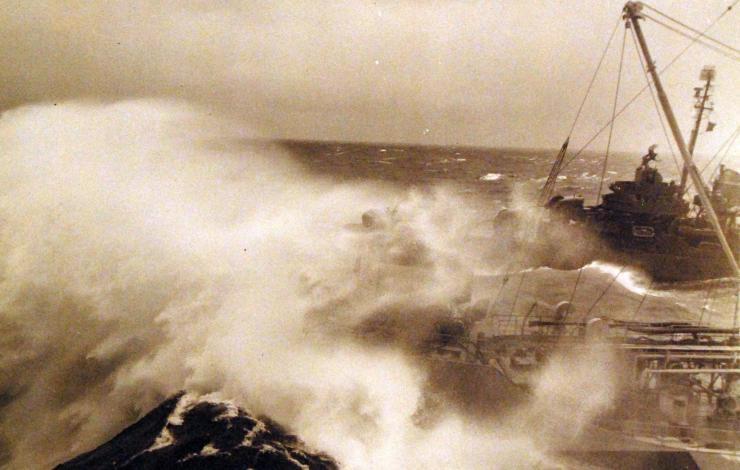
US Ship Pamansett and a destroyer in heavy seas in the East China Sea, 17 January 1945.
A new Old Weather project is now available on the Zooniverse citizen-science platform recovering weather data collected by U.S. Navy ships during World War II (1941-1945) that will drive sophisticated computer models used to reconstruct past weather events and improve future global climate projections. New information gathered through this project will also help uncover the source of a mysterious anomaly in sea-surface temperatures measured during the war. This distortion, known as the World War II Warm Anomaly, is large enough to affect the long-term global mean sea-surface temperature record, and ultimately impacts how we understand climate variability over longer time periods.
It is currently thought the warm ocean temperatures that appeared during World War II are not actually real, but arise due to changes in the way sea-surface temperatures were collected and then compiled into the digital data sets we use today. A critical barrier to verifying and quantifying the effect of different sampling methods used during this period has been the limited access to the original logbooks kept aboard every Navy ship.
Fortunately, most of the ships’ deck logs and war diaries have been preserved by the U.S. National Archives; these have gradually been digitized and published online via a longstanding collaboration with NOAA and the University of Washington’s Cooperative Institute for Climate, Ocean & Ecosystem Studies (CICOES). Online access and Old Weather citizen-scientists’ transcriptions enable entirely new analyses of the marine weather data collected by the Navy during World War II and even as far back as the 1850s.
The ship logbooks being transcribed via the Old Weather – WWII project were chosen not only to provide new-to-science data for the world’s climate data bases, but specifically to help answer questions about the nature of the data itself during this period. The selected ships are representative of the main classes of warship that were in use, and they share some particular characteristics. The most important – these ships were operating together, often within sight of each other, through much of the war. Twelve of the ships were based at Pearl Harbor in 1941, eighteen were in the Aleutian Islands in 1942-1943, and ten were caught in Typhoon Cobra in December 1944. Their proximity in time and space will allow us to investigate for the first time underlying factors associated with the weather data: the potential effect of different ship types, the different weather instruments in use, and changes in methods required by wartime operations, such as darkened ship (blackout).
Once analyzed, these data will allow the research team to quantify the impact of data collected by the Navy during World War II on the global sea-surface temperature record. If the current hypothesis that the warm anomaly is not physical is shown to be correct, the bias-adjusted temperature record would then appear to rise more smoothly through the 20th century. Reconstructions of the atmosphere produced by retrospective analysis (reanalysis) that depend on historical data would also be improved.
The team behind this project: Kevin Wood (University of Washington and NOAA/PMEL), Ed Hawkins and Praveen Teleti (National Centre for Atmospheric Science at the University of Reading), Philip Brohan (UK Met Office), Gil Compo (University of Colorado/NOAA PSL) and Mark Mollan (U.S. Coast Guard Historian’s Office).
Follow along on Zooniverse and the Old Weather Blog.
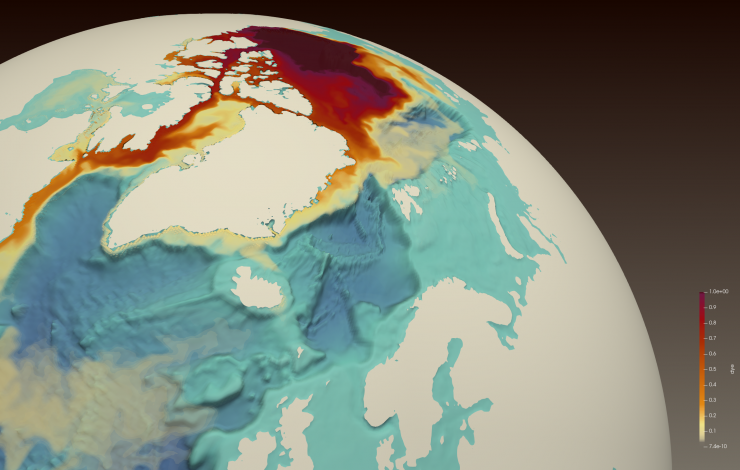
A simulated red dye tracer released from the Beaufort Gyre in the Arctic Ocean (center top) shows freshwater transport through the Canadian Arctic Archipelago, along Baffin Island to the western Labrador Sea, off the coast of Newfoundland and Labrador, where it reduces surface salinity. At the lower left is Newfoundland (triangular land mass) surrounded by orange for fresher water, with Canada’s Gulf of St. Lawrence above colored yellow. Credit: Francesca Samsel and Greg Abram (LANL)
The Beaufort Gyre in the western Arctic Ocean is the largest oceanic freshwater reservoir in the Northern Hemisphere. It has increased its freshwater content by 40% over the past two decades. The fate of the excess freshwater and how and where this water will flow into the Atlantic Ocean is important for local and global ocean conditions. A new paper in Nature Communications, researchers from the University of Washington, NOAA's Pacific Marine Environmental Laboratory and the Department of Energy Los Alamos National Laboratory, show that a historical release during 1983-1996 freshened the western Labrador Sea by as much as 0.2 parts per thousand. The results imply that a future release of the current high volume of Beaufort Gyre freshwater could even be more impactful.
This study is the first that quantifies the fate of the Beaufort Gyre freshwater after it is released and its downstream impact. The study shows that this freshwater travels through the Canadian Archipelago to reach the Labrador Sea, rather than through the wider marine passageways that connect to seas in Northern Europe. The results are based on passive tracers implemented in a global intermediate-resolution ocean sea-ice model, which is performed at the High Performance Computing facility at Los Alamos National Laboratory.
“The Canadian Archipelago is a major conduit between the Arctic and the North Atlantic,” said lead author Jiaxu Zhang, a UW postdoctoral researcher at the Cooperative Institute for Climate, Ocean and Ecosystem Studies who began this work at Los Alamos National Laboratory. “In the future, if the winds get weaker and the freshwater gets released, there is a potential for this high amount of water to have a big influence in the Labrador Sea region.”
The finding has implications for the Labrador Sea marine environment, since Arctic water tends to be fresher but also rich in nutrients. This pathway also affects larger oceanic currents, namely a conveyor-belt circulation in the Atlantic Ocean in which colder, heavier water sinks in the North Atlantic and comes back along the surface as the Gulf Stream. Fresher, lighter water entering the Labrador Sea could slow that overturning circulation.
“We know that the Arctic Ocean has one of the biggest climate change signals,” said co-author Wei Cheng at the UW-based Cooperative Institute for Climate, Ocean and Atmosphere Studies. “Right now this freshwater is still trapped in the Arctic. But once it gets out, it can have a very large impact."
The exact impact is unknown. The study focused on past events, and current research is looking at where today’s freshwater buildup might end up and what changes it could trigger.
Read the full University of Washington News Release.
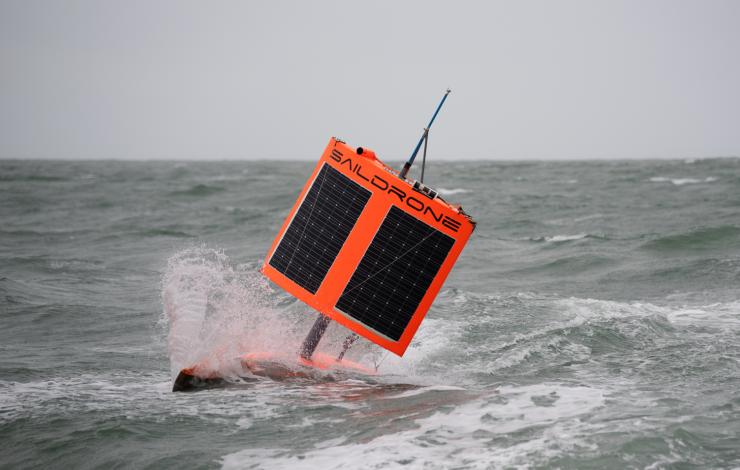
SD 1020 approaches Point Bluff, New Zealand, in stormy conditions after finishing the First Saildrone Antarctic Circumnavigation, sailing 22,000 kilometers around the Southern Ocean in 196 days. Photo Credit: Saildrone, Inc.
When a saildrone, an uncrewed, instrumented autonomous vehicle, circumnavigated Antarctica during the winter of 2019, it marked a technological triumph over some of the fiercest marine conditions on Earth. Now, analysis of direct measurements collected during this epic voyage are highlighting questions about the vast circumpolar ocean’s role in storing carbon dioxide. The findings were published in the journal Geophysical Research Letters.
Covering only 30 percent of Earth's ocean surface, the Southern Ocean plays an outsized role in the global climate. It is the meeting point of ocean currents, and an important connector between the atmosphere and deep ocean for the transfer of heat and carbon. Based on measurements collected from ships over several decades, scientists concluded that the Southern Ocean is a major buffer against climate change, absorbing as much as 75 percent of the excess heat and 40 percent of human-generated carbon dioxide (CO2) emissions taken up by the global oceans.
More recently though, biogeochemical measurements taken by autonomous Argo floats between 2014 and 2017 suggest the Southern Ocean’s role as a carbon “sink” that absorbs CO2 is much smaller - perhaps barely any sink at all, said Adrienne Sutton, an oceanographer with NOAA’s Pacific Marine Environmental Laboratory, who is investigating the discrepancy between ship and float data. “If we’re wrong about the Southern Ocean being a strong sink, then where’s all that carbon dioxide going?” Sutton asked. “The answer is important for understanding how the Earth system is responding to climate change.”
Ocean measurements are key to understanding the global carbon cycle, and how the natural ocean and land serve as sinks for carbon and are responding to climate change driven by concentrations of CO2 in the atmosphere. By directly measuring wind speed, along with CO2 in the air and surface seawater, scientists were able to observe CO2 exchange between the ocean and atmosphere every hour during the mission. Using these data, they estimated potential errors in these measurements, as well as potential errors due to other approaches to estimating CO2 exchange.
Although data showed the ocean was both absorbing and emitting CO2 during the voyage, outgassing was prevalent during late fall and early winter in the Indian Ocean sector of the Antarctic Zone, which comprised about one third of the route.
“The outgassing we measured in 2019 was not as strong as the outgassing measured by Argo biogeochemical floats in this same region in 2014 and 2015, so we expect that CO2 flux conditions are highly variable from year to year,” Sutton said.
Read the full story on NOAA Research.
Shelled pteropods, microscopic free-swimming sea snails, are widely regarded as indicators for ocean acidification because research has shown that their fragile shells are vulnerable to increasing ocean acidity. Sometimes called sea butterflies because of how they appear to flap their “wings” as they swim through the water column, fat-rich pteropods are an important food source for organisms ranging from other plankton to juvenile salmon to whales. They make shells by fixing calcium carbonate in ocean water to form an exoskeleton.
A new study, published in the journal Scientific Reports, shows that pteropods sampled off the coasts of Washington and Oregon made thinner shells than those in offshore waters. Along the coast, upwelling from deeper water layers brings cold, carbon dioxide-rich waters of relatively low pH to the surface. The research team of Dutch and American scientists found that the shells of pteropods collected in this upwelling region were 37 percent thinner than ones collected offshore.
“It appears that pteropods make thinner shells where upwelling brings water that is colder and lower in pH to the surface, ” said lead author Lisette Mekkes of Naturalis Biodiversity Centers and the University of Amsterdam in the Netherlands. Mekkes added that while some shells also showed signs of dissolution, the change in shell thickness was particularly pronounced, demonstrating that acidified water interfered with pteropods’ ability to build their shells.
The scientists examined shells of pteropods collected during the 2016 NOAA Ocean Acidification Program research cruise in the northern California Current Ecosystem onboard the NOAA Ship Ronald H. Brown. Shell thicknesses of 80 of the tiny creatures - no larger than the head of a pin - were analyzed using 3D scans provided by micron-scale computer tomography, a high-resolution X-ray technique. The scientists also examined the shells with a scanning electron microscope to assess if thinner shells were a result of dissolution. They also used DNA analysis to make sure the examined specimens belonged to a single population.
"Pteropod shells protect against predation and infection, but making thinner shells could also be an adaptive or acclimation strategy," said Katja Peijnenburg, group leader at Naturalis Biodiversity Center. "However, an important question is how long can pteropods continue making thinner shells in rapidly acidifying waters?"
The California Current Ecosystem along the West Coast is especially vulnerable to ocean acidification because it not only absorbs carbon dioxide from the atmosphere, but is also bathed by seasonal upwelling of carbon-dioxide rich waters from the deep ocean. In recent years these waters have grown increasingly corrosive as a result of the increasing amounts of atmospheric carbon dioxide absorbed into the ocean.
“Our research shows that within two to three months, pteropods transported by currents from the open-ocean to more corrosive nearshore waters have difficulty building their shells,” said Nina Bednarsek, a research scientist from the Southern California Coastal Water Research Project in Costa Mesa, California, a coauthor of the study.
Over the last two-and-a-half centuries, scientists say, the global ocean has absorbed approximately 620 billion tons of carbon dioxide from emissions released into the atmosphere by burning fossil fuels, changes in land-use, and cement production, resulting in a process called ocean acidification.
“The new research provides the foundation for understanding how pteropods and other microscopic organisms are actively affected by progressing ocean acidification and how these changes can impact the global carbon cycle and ecological communities,” said Richard Feely, NOAA Pacific Marine Environmental Laboratory and chief scientist for the cruise.
This research was supported by NOAA’s Ocean Acidification Program and the Netherlands Organization for Scientific Research. Story originally posted on NOAA Research.
2020 Arctic Report Card Released: 15 years of observations document impact of changing polar climate
NOAA’s 15th Arctic Report Card catalogs for 2020 the numerous ways that climate change continues to disrupt the polar region, with second-highest air temperatures and second-lowest summer sea ice driving a cascade of impacts, including the loss of snow and extraordinary wildfires in northern Russia. The sustained transformation to a warmer, less frozen and biologically changed Arctic remains clear.
The average annual land-surface air temperature in the Arctic measured between October 2019 and September 2020 was the second-warmest since record-keeping began in 1900, and was responsible for driving a cascade of impacts across Arctic ecosystems during the year. Nine of the past 10 years saw air temperatures at least 1 degree C above (2.2 degrees F) the 1981-2010 mean. Arctic temperatures for the past six years have all exceeded previous records.Record warm temperatures in the Eurasian Arctic were associated with extreme conditions in the ocean and on the land.
Sea ice loss in spring 2020 was particularly early in the East Siberian Sea and Laptev Sea regions, setting new record lows in the Laptev Sea for June. The end of summer sea ice extent in 2020 was the second lowest in the 42-year satellite record, with 2012 being the record minimum year. Overall thickness of the sea ice cover is also decreasing as Arctic ice has transformed from an older, thicker, and stronger ice mass to a younger, thinner more fragile ice mass in the past decade.
PMEL’s Dr. James Overland, Dr. Muyin Wang (UW/CICOES), and Dr. Kevin Wood (UW/CICOES) contributed to sections on surface air temperature and sea ice. Dr. Overland is one of three founding editors of the Arctic Report Card and served as a co-editor from 2006 - 2017. Read the full interview about his work in the Arctic and with the Arctic Report Card.
The Arctic Report Card is an annual compilation of original, peer-reviewed environmental observations and analyses of a region undergoing rapid and dramatic alterations to weather, climate, oceanic, and land conditions. Compiled by 133 scientists from 15 countries, the 2020 report card tracks environmental indicators to inform decisions by local, state and federal leaders confronting a rapidly changing climate and ecosystems.
Check out the visual highlights and the full Arctic Report Card.
Read the original NOAA Press Release.
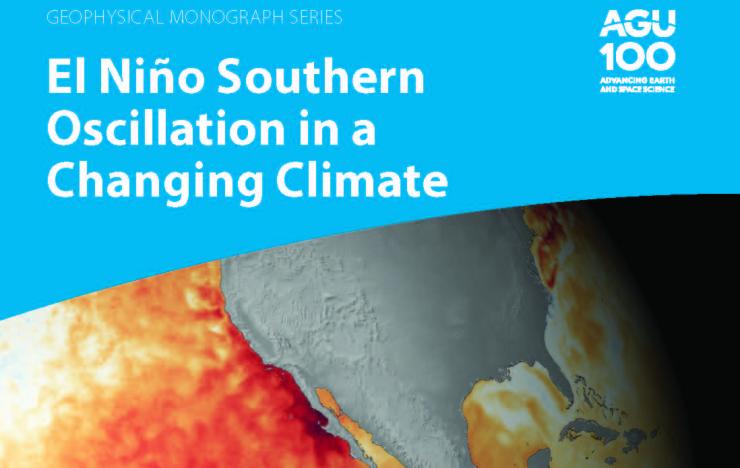
Satellite sea surface temperature departure for October 2015 over the Pacific. Orange-red colors indicate above normal temperatures, indicative of an El Niño condition. The 2015-16 El Niño was the first extreme El Niño of the 21st century and among the three strongest El Niños on record. Credit: NOAA National Environmental Satellite, Data, and Information Service (NESDIS)
The El Niño Southern Oscillation (ENSO) in the Pacific Ocean has major worldwide social and economic consequences through its global scale effects on atmospheric and oceanic circulation, marine and terrestrial ecosystems, and other natural systems. It is the most dramatic year-to-year variation of the Earth’s climate system, affecting agriculture, public health, freshwater availability, power generation, and economic activity in the United States and around the globe. Ongoing climate change is projected to significantly alter ENSO’s dynamics and impacts.
The future of ENSO is the subject of a new book published by the American Geophysical Union. With 21 chapters written by 98 authors from 58 research institutions in 16 countries, the volume covers the latest theories, models, and observations, and explores the challenges of forecasting El Niño and La Niña. The book, “El Niño Southern Oscillation in a Changing Climate” was published online on November 2.
“This is the first comprehensive examination of how ENSO, its dynamics and its impacts may change under the influence of rising greenhouse gas concentrations in the atmosphere,” said Michael McPhaden, senior scientist with PMEL's Global Tropical Moored Buoy Array, and co-editor of the new volume. Two other co-editors are from Australia: Agus Santoso, a scientist with the University of New South Wales, and Wenju Cai, a researcher with the Commonwealth Scientific and Industrial Research Organisation, also known as CSIRO.
The new book, three years in the making, tracks the historical development of ideas about ENSO, explores underlying physical processes and reveals the latest science on how ENSO responds to external factors such as climate phenomena outside the tropical Pacific, volcanic eruptions, and anthropogenic greenhouse gas forcing.
How are ENSO impacts likely to evolve in the coming decades?
“Extreme El Niño and La Niña events may increase in frequency from about one every 20 years to one every 10 years by the end of the 21st century under aggressive greenhouse gas emission scenarios,” McPhaden said. “The strongest events may also become even stronger than they are today.”
In a warming climate, rainfall extremes are projected to shift eastward along the equator in the Pacific Ocean during El Niño events and westward during extreme La Niña events. Less clear is the potential evolution of rainfall patterns in the mid-latitudes, but extremes may be more pronounced if strong El Niños and La Niñas increase in frequency and amplitude, he said.
Some ENSO impacts are already being amplified, such as the extensive coral bleaching and increases in tropical Pacific storm activity observed during the 2015-16 El Niño. ENSO is expected to impact tropical cyclone genesis in the future as it does today in the Atlantic, Pacific and Indian Oceans, but precisely how is still an open question.
Read more on the NOAA Research feature and AGU highlight.
To learn more about El Nino and La Nina and the research PMEL does, visit https://www.pmel.noaa.gov/elnino/pmel-research-activities