What's New Archive
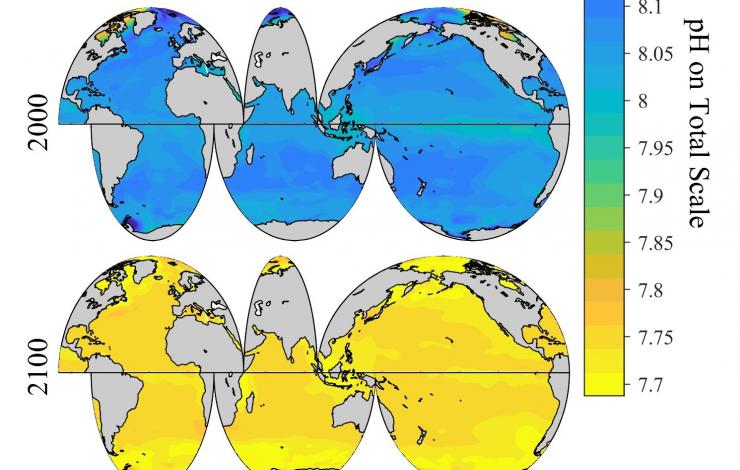
The climatology developed in this study shows pH trajectories from the past and into the future.
New research by NOAA, the University of Maryland, and international partners published in Nature Scientific Reports shows that the changing chemistry of seawater has implications for continued greenhouse gas absorption.
The ocean has been playing an important role in helping slow down global climate change by removing the greenhouse gas carbon dioxide (CO2) from the atmosphere. However, decades of ocean observations show that the CO2 absorbed by the ocean is changing the chemistry of seawater, a process known as ocean acidification. The study discusses the reduced buffering capacity of the ocean as pH levels drop and its implications for reducing the ocean’s role as a CO2 sink in the future.
The researchers from NOAA's PMEL and NCEI and research institutions in Norway stress the importance of leveraging in situ observation-based global pH data products to help improve model projections. A climatology developed from this research may lead to more preventive and adaptive solutions to reduce carbon dioxide emissions and, at the same time, allow for ocean acidification adaptation strategies in regional areas.
The CO2 Problem
Ocean acidification occurs when the ocean absorbs carbon dioxide from the atmosphere. Anthropogenic, or human-caused, carbon dioxide comes from greenhouse gas emissions. Emissions from the burning of fossil fuels, cement production, and deforestation have pumped about two trillion tons of carbon dioxide into the atmosphere since the beginning of the Industrial Revolution. Deforestation adds to the issue by contributing about 10 percent of all carbon dioxide emissions. The deforestation of the Amazon rainforest has a particularly devastating effect on rising CO2 levels.
The ocean has taken up about 25 percent of the excess gas, the equivalent of over 600 billion tons of carbon dioxide, from 1750 to 2015. As atmospheric CO2 levels increase, so do the levels in the ocean.
When seawater absorbs carbon dioxide its acidity is increased, which decreases the building blocks used by shellfish to grow their shells. Some studies have shown that ocean acidification has negative implications for marine life, particularly clams, mussels, coral reefs, and small sea snails, which could have difficulty building or maintaining their shells in increasingly acidic waters.
A Decreasing Buffer
The capacity of ocean waters to take up surplus anthropogenic CO2 has been decreasing rapidly. This study suggests that the ocean’s “buffer capacity” could decrease by as much as 34 percent from 2000 to 2100 under the Intergovernmental Panel on Climate Change (IPCC) RCP8.5 scenario, which is the highest “Representative Concentration Pathway” of potential greenhouse gas emissions and atmospheric concentration levels through 2100. The rapid decrease in this "buffer capacity" suggests that while the ocean will likely continue to take up more CO2 in the future due to the increasing atmospheric CO2 concentrations, the proportion of anthropogenic carbon dioxide entering the ocean will decrease. The ocean’s role in buffering global climate change will gradually diminish, and ocean acidification could accelerate.
Improving Trajectories
The study is the first of its kind to link modern observed pH data with modeled carbon dioxide projections to provide a high-resolution regional view of the pH trajectory in all locations of the global surface ocean.
The work will provide improved regional ocean acidification trajectories, above what the model output could produce alone. Comparison with the model outputs show that this climatology could improve pH projection by up to ~0.06 pH units at certain locations of the global ocean, equivalent to a 15 percent acidity difference, or ~3 decades of pH change.
Funding for this study was provided by NOAA's Ocean Acidification Program and Ocean Observing and Monitoring Division. Along with NOAA, researchers were affiliated with the Earth System Science Interdisciplinary Center (ESSIC) at the University of Maryland and the Joint Institute for the Study of the Atmosphere and Ocean at the University of Washington, both NOAA cooperative institutes, as well as, NORCE Norwegian Research Centre, Bjerknes Centre for Climate Research, Bergen, Norway, and Geophysical Institute, University of Bergen.
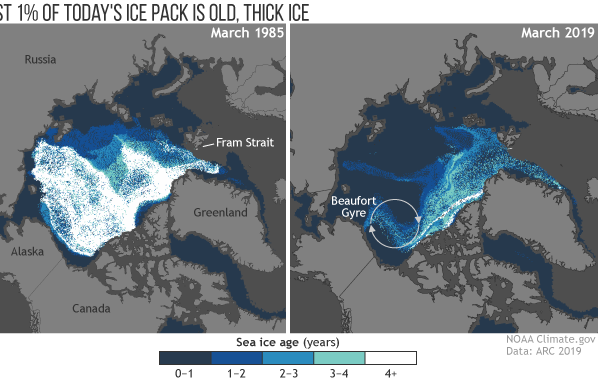
The proportion of old, thick ice in the Arctic's winter maximum ice pack has dropped from more than a third in the mid-1980s to barely just 1 percent today. See more visual highlights: https://www.climate.gov/news-features/understanding-climate/2019-arctic-report-card-visual-highlights
NOAA recently released the 2019 Arctic Report Card at the American Geophysical Union Fall Meeting providing updates on the ongoing impact of changing conditions in the Arctic on the environment and communities, especially from continued warming and record sea ice loss. This work brings together 81 scientists from 12 nations to provide the latest in peer-reviewed, actionable environmental information on the current state of the Arctic environmental system relative to historical records.
The average annual land surface air temperature north of 60° N for October 2018-August 2019 was the second warmest since 1900. The warming air temperatures are driving changes in the Arctic environment that affect ecosystems and communities on a regional and global scale.
In the marine environment, August mean sea surface temperatures in 2019 were 1-7°C warmer than the 1982-2010 August mean in the Beaufort and Chukchi Seas, the Laptev Sea, and Baffin Bay. Arctic sea ice extent at the end of summer 2019 was tied with 2007 and 2016 as the second lowest since satellite observations began in 1979. The thickness of the sea ice has also decreased, resulting in an ice cover that is more vulnerable to warming air and ocean temperatures. The winter sea ice extent in 2019 narrowly missed surpassing the record low set in 2018, leading to record-breaking warm ocean temperatures in 2019 on the southern shelf. Bottom temperatures on the northern Bering shelf exceeded 4°C for the first time in November 2018. Bering and Barents Seas fisheries have experienced a northerly shift in the distribution of subarctic and Arctic fish species, linked to the loss of sea ice and changes in bottom water temperature.
Less than 1 percent of Arctic ice has survived four or more summers In March 1985, sea ice at least four years old made up 33 percent of the ice pack in the Arctic Ocean; in March 2019, ice that old made up 1.2 percent of the pack. Instead, more than three-quarters of the winter ice pack today consists of thin ice that is just a few months old, whereas in the past it was just over half.
PMEL’s Dr. James Overland, Dr. Muyin Wang, Dr. Kevin Wood, and Dr. Carol Ladd contributed to sections on surface air temperature, sea ice and sea surface temperatures.
Read more highlights and the full Arctic Report card here.
The NOAA Press Release can be found here.

Remnants of the winter’s fast ice off of Cape Lisburne, Alaska taken from NOAA Twin Otter 56 in May 2017.
International team assesses widespread effects of polar warming
With 2019 on pace as one of the warmest years on record, a new study published today in the journal Science Advances, reveals how rapidly the Arctic is warming and examines global consequences of continued polar warming. The study reports that the Arctic has warmed by 0.75oC in the last decade alone. By comparison, the Earth as a whole has warmed by nearly the same amount, 0.8oC, over the past 137 years.
“Many of the changes over the past decade are so dramatic they make you wonder what the next decade of warming will bring,” said lead author Eric Post, a UC Davis professor of climate change ecology. “If we haven't already entered a new Arctic, we are certainly on the threshold.”
What 2 degrees global warming means for the poles
The comprehensive report represents the efforts of an international team of 15 authors specializing in an array of disciplines, including the life, Earth, social, and political sciences. They documented widespread effects of warming in the Arctic and Antarctic on wildlife, traditional human livelihoods, tundra vegetation, methane release, and loss of sea- and land ice. They also examined consequences for the polar regions as the Earth inches toward 2oC warming, a commonly discussed milestone.
“Under a business-as-usual scenario, the Earth as a whole may reach that milestone in about 40 years,” said Post. “But the Arctic is already there during some months of the year, and it could reach 2oC warming on an annual mean basis as soon as 25 years before the rest of the planet.”
The study illustrates what 2oC of global warming could mean for the high latitudes: up to 7oC warming for the Arctic and 3oC warming for the Antarctic during some months of the year.
The authors say that active, near-term measures to reduce carbon emissions are crucial to slowing high latitude warming, especially in the Arctic.
Beyond the polar regions
Major consequences of projected warming in the absence of carbon mitigation are expected to reach beyond the polar regions. Among these are sea level rise resulting from rapid melting of land ice in the Arctic and Antarctic, as well as increased risk of extreme weather, deadly heat waves, and wildfire in parts of the Northern Hemisphere.
“What happens in the Arctic doesn’t stay in the Arctic,” said co-author Michael Mann, a distinguished professor of atmospheric sciences at Penn State. “The dramatic warming and melting of Arctic ice is impacting the jet stream in a way that gives us more persistent and damaging weather extremes.”
Muyin Wang, research meteorologist with the University of Washington Joint Institute for the Study of the Ocean and Atmosphere and NOAA PMEL is a co-author of the research. Other institutions include Pennsylvania State University; Aarhus University; University of Oxford; University of Lapland; University of Colorado, Boulder; Chicago Botanic Garden; Dartmouth College; Umea University; University College London; U.S. Arctic Research Commission; and Harvard University.
Funding for the study was provided by grants from the U.S. National Science Foundation, Academy of Finland and JPI Climate, National Geographic Society, Natural Environment Research Council, the Swedish Research Council, U.S. National Aeronautics and Space Administration, and NOAA.
Originally posted on UC Davis on December 4, 2019.
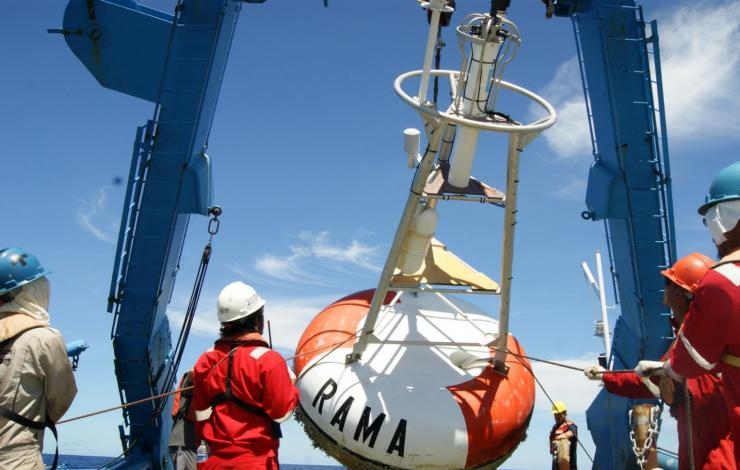
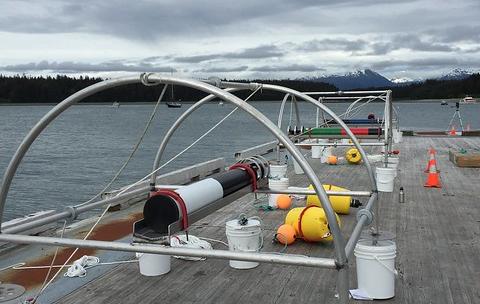
Buoys part of the Research Moored Array for African-Asian-Australian Monsoon Analysis and Prediction (RAMA) are designed to study the Indian Ocean’s role in the monsoons.
Rainfall declines may affect U.S. West Coast and parts of the East Coast
New research by NOAA and a visiting scientist from India shows that warming of the Indo-Pacific Ocean is altering rainfall patterns from the tropics to the United States, contributing to declines in rainfall on the United States west and east coasts.
In a study published this week in the journal Nature, researchers report a doubling in the size of a warm pool of water spanning the western Pacific and eastern Indian Ocean in recent years. This Indo-Pacific warm pool in what is already the warmest part of the global ocean is expanding each year by an area the size of California.
The expansion is changing a key weather and climate feature called the Madden Julian Oscillation, which is characterized by a band of rain clouds that move over the tropical ocean from the Seychelles off Africa toward India and into the Pacific Ocean, influencing everything from monsoons in India to heat waves and flooding in the United States.
Warming ocean driving change in key climate pattern
The changes in the behavior of the MJO have brought a decline in rainfall to the central Pacific, the west and east coasts of the United States, north India, east Africa and the Yangtze basin in China. These same changes are causing an increase in rainfall over northern Australia, the Amazon basin, southwest Africa and Southeast Asia, researchers conclude.
“NOAA is part of coordinated international efforts to extend the range of accurate weather forecasts out to lead times of two to four weeks and the MJO is one of the most important keys to the success of this enterprise,” said Michael McPhaden, a senior scientist at NOAA’s Pacific Marine Environmental Lab and co-author of the study. “Our research provides a critical benchmark for determining which computer models to trust for extended range weather forecasting, based on their ability to simulate the observed behavior of the MJO in changing the climate.”
Though the entire Indo-Pacific Ocean has warmed, the warmest waters are over the west Pacific, creating a temperature contrast that drives moisture from the Indian Ocean to the west, enhancing cloud formation. This has changed the life cycle of the MJO. The length of time these clouds linger over the Indian Ocean has shrunk by four days from an average of 19 to 15 days. Over the west Pacific, the clouds now reside five more days. It is this change in the residence of MJO-driven clouds that is altering weather patterns around the globe, researchers found.
“Climate model simulations indicate that continued warming of the Indo-Pacific Ocean is highly likely, which may further intensify these changes in global rainfall patterns,” said Roxy Mathew Koll, lead author of the study with the Indian Institute of Tropical Meteorology who worked with McPhaden while visiting PMEL for the last year. “This means that we need to enhance our ocean observational arrays to monitor these changes accurately, and update our climate models to skillfully predict the challenges presented by a warming world.”
The study is part of a collaboration between NOAA and India’s Ministry of Earth Sciences, facilitated by the National Academy of Sciences with funding from NOAA’s Climate Program Office Climate Variability and Predictability Program. In addition to McPhaden, Chidong Zhang, also of NOAA PMEL, is a co-author of the research.
Originally posted on NOAA Research on November 27, 2019.
Dr. Trish Quinn studies the effects of atmospheric aerosol particles on air quality and climate at NOAA's Pacific Marine Environmental Laboratory.
Dr. Patricia Quinn of NOAA’s Pacific Marine Environmental Laboratory has been named a Fellow of the American Association for the Advancement of Science (AAAS). Election as a AAAS Fellow is an honor bestowed upon AAAS members by their peers. This year 443 members have been awarded this honor by AAAS because of their scientifically or socially distinguished efforts to advance science or its applications.
As part of the Atmospheric and Hydrospheric Sciences Section, Dr. Quinn was elected as an AAAS Fellow for her exceptional scientific contributions to our understanding of atmospheric aerosols and their climate impact.
Dr. Quinn has been with PMEL for over 25 years and is currently the lead for the Atmospheric Chemistry group studying the effects of atmospheric aerosol particles on air quality and climate. She has participated in research cruises since 1986, studying a broad range of aerosol types ranging from remote marine aerosol in the Arctic and Antarctic to pollution aerosol in the Houston Ship Channel and the oil and gas fields of Utah’s Uintah Basin.
Dr. Quinn has also been recognized as a highly cited researcher in Web of Science (2016, 2017, and 2018) and selected as an AGU Fellow in 2010.
Read the full announcement in the AAAS News and Notes section of the journal Science on 29 November 2019.
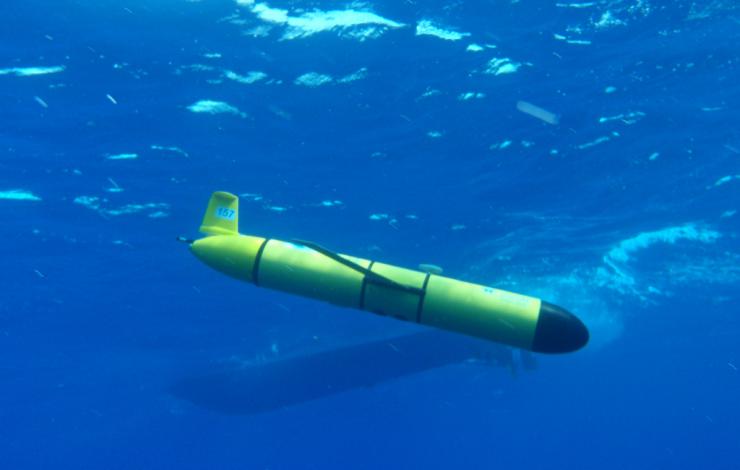
Ocean gliders are a quiet and efficient mobile autonomous platform for passive acoustic monitoring and oceanographic measurements in remote marine environments. Researchers equipped a Teledyne Webb Research Slocum glider with a hydrophone to record sound along the US Pacific Northwest coast.
NOAA and Oregon State University researchers have developed an effective method to use an underwater robotic glider to measure sound levels over broad areas of the ocean, published today in the journal PLOS ONE.
“Healthy marine ecosystems need to have noise levels within particular ranges,” said Joe Haxel, lead author of the paper and assistant professor/senior research at Oregon State University and part of NOAA’s Pacific Marine Environmental Lab Acoustics Program. “As an analogy for humans it’s the difference between living in the country or living in the city or somewhere really loud.”
Ocean sound was recently listed as an essential ocean variable by the Global Ocean Observing System, a UNESCO program, due to its importance for marine life and seagoing humans and because it is used to monitor and locate everything from earthquakes to tsunamis to nuclear explosions.
Traditionally, scientists have measured ocean sound by attaching hydrophones, essentially an underwater microphone, to a fixed mooring in the water. The problem with that is scientists only get data from that single location. Ocean sound can also be measured from a research ship, but they are expensive to operate. They also create a lot of noise themselves, which disturbs marine animals and fish that are sensitive to sound.
Attaching a hydrophone to a glider solves those problems because gliders operate autonomously, relatively quietly and can cover hundreds of miles over several weeks.
Gliders equipped with hydrophones can conduct repeated surveys of a region of concern for acoustic habitat degradation and provide real-time measurements of changing noise levels. Gliders have also successfully been used by scientists to measure noise from an underwater volcano and to predict surface wind speeds. An additional benefit of gliders is that they are outfitted with other sensors and instruments that provide important measurements, such as temperature, salinity and depth.
In the research described in the PLOS ONE paper, the research team attached the hydrophone to the glider, which is about 5 feet long and weighs about 120 pounds. The glider traveled for 18 days between Grey’s Harbor, Washington and Brookings, Oregon, a distance of about 285 miles. The glider operated along the North American continental shelf break, which on average is about 30 miles off the coast where the ocean depth begins to drop more steeply. The shelf break is a key migratory path for marine animals.
Once the scientists retrieved the hydrophone data, their main challenge was fine-tuning their algorithms to filter out the noise the glider creates when operating. After that filtering occurred, the researchers were able to cross-reference the data collected during the 18-day glider trip with historical data from hydrophones attached to moorings along that route.
Haxel said it was pretty shocking how closely the data sets aligned. That led the team to conclude that the gliders are an effective and valuable asset for measuring underwater ocean sound.
Read the paper here: https://doi.org/10.1371/journal.pone.0225325
The story was originally published by Oregon State University on November 20, 2019.
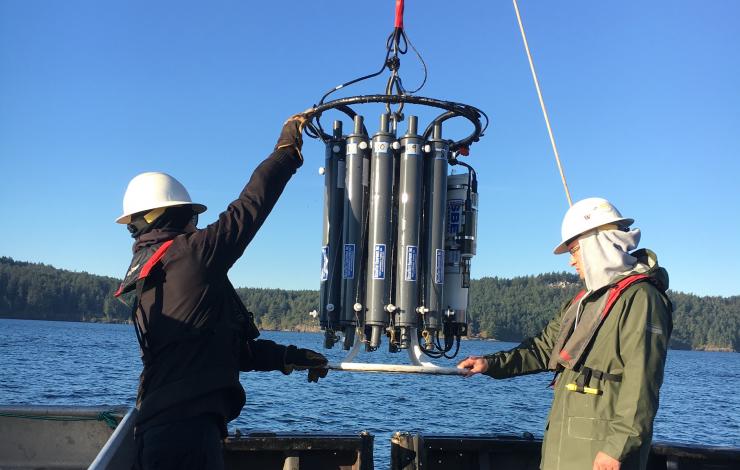
Deploying a CTD aboard the RV Centennial (Photo Credit: University of Washington - Rachel Wold)
A new report details the effects of a changing climate on Puget Sound in 2018, and describes how these changes trickled down through the ecosystem to affect marine life and seafood consumers. Since 2011, Puget Sound Marine Waters has compiled data from numerous environmental monitoring programs to report on the state of Puget Sound’s marine waters during the previous year.
In 2018, Puget Sound witnessed the effects of a changing climate. Total annual rainfall was near normal for 2018, but the Puget Sound experienced a wetter than normal spring, followed by a record-setting summer drought. These conditions resulted in waters that were warmer and saltier than past averages and had lower oxygen levels. Scientists observed unusually warm water temperatures, though not as hot as during the years of “the Blob,” the marine heatwave of 2014-2016. Salinity went up everywhere in the Puget Sound through the summer and fall, in response to the record-setting summer drought. Hypoxia (a lack of oxygen) was more apparent in 2018 than previous years, though no fish kills were reported. Scientists reported lower numbers of fish, seabirds, and marine mammals, including continuing declines in endangered Southern Resident killer whales.
Atmospheric carbon dioxide (CO2) measured off the coast and in Puget Sound continued its annual increase, with coastal values near the global average and Puget Sound values in excess. In stratified basins, CO2 concentrations in surface seawater are quite different from those measured at depth. Levels potentially conducive to hypercapnia (harmfully high CO2) were present in the deep waters of Whidbey Basin and Hood Canal during 2018. Atmospheric measurements of the mole fraction of carbon dioxide (xCO2) at the Ćháʔba· and Cape Elizabeth moorings on the Washington shelf continued their year-to-year increases in 2018, and were similar to the global averages. The summertime minimum was earlier at Cape Elizabeth in 2018 relative to other years. 2018 surface seawater xCO2 values at Ćháʔba· and Cape Elizabeth were within the range of past years.
The Puget Sound Ecosystem Monitoring Program’s Marine Waters Work Group, who authored the report, has been tracking the health of Puget Sound since 2011. This work group includes scientists from federal, tribal, state and local agencies, academia, nonprofits, and private and volunteer groups.
The work group looked at several environmental indicators, including plankton, water quality, climate, and marine life, that, when considered together, provide both a long-term view and current assessment of the Sound’s health.
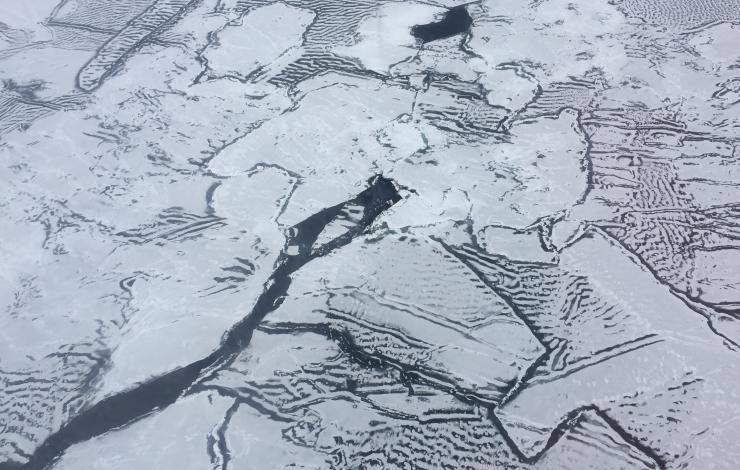
A mosaic of young sea ice captured during a flight campaign over the Chukchi Sea launching various atmospheric and oceanographic probes and floats.
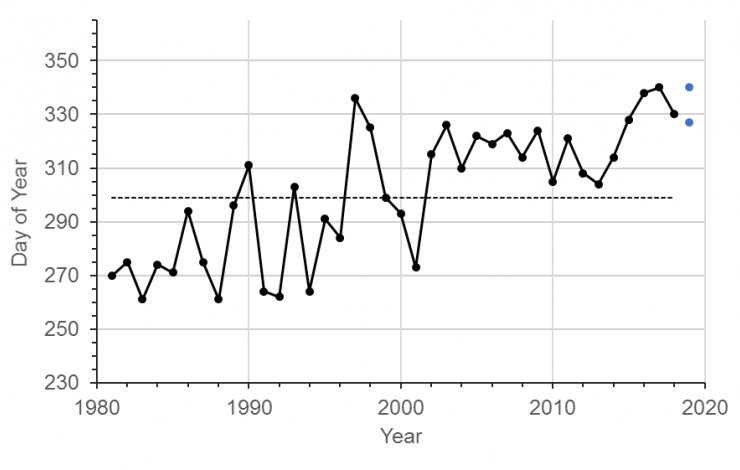
The black dots show the observed day of year that sea-ice concentration in the reference area northwest of Icy Cape first reaches 30%, as determined from passive microwave data. The blue markers show the range (14 days) of the projected onset of freeze in 2019. The dashed line shows the long-term mean (1981-2016).
PMEL has released an experimental annual freeze-up projection for the Chukchi Sea continental shelf northwest of Icy Cape. The freeze onset is projected to begin between 23 November and 6 December 2019. This is 28-41 days later than the long-term average (1981-2016). At freeze-up in 2019, sea-ice in the northwest of Icy Cape will consist entirely of thin, newly formed types (e.g. sheets and thin pancake), especially near the coast. For this projection, the onset metric is defined by sea-ice concentration reaching 30% as determined by passive microwave observations collected in the area around Icy Cape in the Chukchi Sea.
The data considered in this projection includes observations collected from autonomous ocean profiling floats, aircraft and satellite-derived visible imagery, and SST radiometry in 2016, 2017, 2018 and 2019. Persistence of sea ice was evaluated using historical ice concentration data from passive microwave satellites, provided by the National Snow and Ice Data Center (NSIDC).
The purpose of this experiment is to develop an informed basis for advising a hypothetical maritime interest operating in the region and to identify conditions that cause sudden large departures (increase in risk). It also provides a result that can be evaluated against other methodologies. Data from various technologies deployed during the Arctic Heat flight campaigns help to fill in data gaps in the Arctic and determine limiting factors in projecting sea ice freeze up in hopes of improving seasonal model forecasts.
Read the full projection and rationale here: https://www.pmel.noaa.gov/arctic-heat/projected-onset-freeze-chukchi-sea-continental-shelf-2019
Learn more about the work being done on the Arctic Heat page: https://www.pmel.noaa.
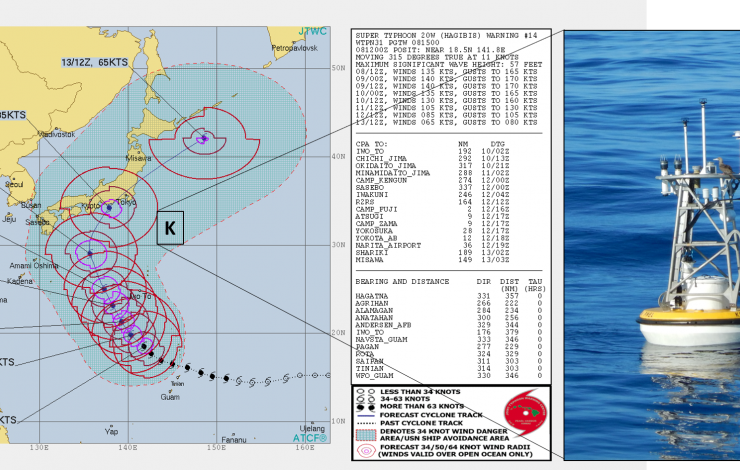
The location of the KEO moored buoy shown on the right is denoted with a “K” on the Joint Typhoon Warning Center’s map of the forecasted Super Typhoon Hagibis track.
At the end of September, PMEL and partners aboard the Kaiyo Maru #1 successfully completed the Kuroshio Extension Observatory (KEO) mooring turnaround cruise during typhoon season. Although the cruise faced delays due to typhoon Tapah, the KEO mooring was both deployed and recovered successfully in a single 24-hour period, and was ready to observe Super Typhoon Hagibis, which made landfall on October 12. In addition to the mooring, four JAMSTEC backscatters meters and an underwater camera were deployed.
KEO continues to demonstrate its dual-purpose of relaying real-time weather information and contributing to longer climatological records. The KEO mooring is also known as a storm mooring due to its prime location to observe the transition of tropical cyclones to extra-tropical storms and measure the exchanges of heat and moisture between the atmosphere and ocean during these storms. Partners such as the Japan Agency for Marine-Earth Science and Technology (JAMSTEC) use the KEO mooring site to conduct their own research and enhance the mooring with additional sensors.
Typhoons are common in the western North Pacific in the summer and fall. On average, a typhoon passes within 500 nautical miles of the KEO mooring every two weeks during the peak of the tropical cyclone season. Data from ocean climate stations moorings can be used to help improve weather and storm forecasts, inform climate projections, and verify satellite products and models. The Kuroshio Extension current carries warm water into the North Pacific and is a region where the ocean generally loses heat to the atmosphere. The exchange of heat and moisture into the atmosphere is an important factor in the development of storms over the north Pacific before they reach the United States.
Staging an autonomous underwater hydrophone for deployment in Glacier Bay National Park and Preserve.
Storms, boat traffic, animal noises and more contribute to the underwater sound environment in the ocean, even in areas considered protected, a new study from Oregon State University, Cornelle University, National Park Service, and NOAA PMEL and NOAA Fisheries scientists shows.
Using underwater acoustic monitors, researchers listened in on Stellwagen Bank National Marine Sanctuary off the coast of Boston; Glacier Bay National Park and Preserve in Alaska; National Park of American Samoa; and Buck Island Reef National Monument in the Virgin Islands. They found that the ambient sounds varied widely across the sites and were driven by differences in animal vocalization rates, human activity and weather.
The findings demonstrate that sound monitoring is an effective tool for assessing conditions and monitoring changes, said Samara Haver, a doctoral candidate in the College of Agricultural Sciences at OSU and the study’s lead author. “This is a relatively economical way for us to get a ton of information about the environment,” said Haver, who studies marine acoustics and works out of the Cooperative Institute for Marine Resources Studies, a partnership between OSU and the National Oceanic and Atmospheric Administration at the Hatfield Marine Science Center in Newport. “Documenting current and potentially changing conditions in the ocean soundscape can provide important information for managing the ocean environment.”
Passive acoustic monitoring is seen as a cost-effective and low-impact method for monitoring the marine environment. The researchers’ goal was to test how effective acoustic monitoring would be for long-term assessment of underwater conditions.
“Ocean noise levels have been identified as a potential measure for effectiveness of conservation efforts, but until now comparing sound across different locations has been challenging,” Haver said. “Using equipment that was calibrated across all of the sites, we were able to compare the sound environments of these diverse areas in the ocean.”
The researchers collected low frequency, passive acoustic recordings from each of the locations between 2014 and 2018. They compared ambient sounds as well as sounds of humpback whales, a species commonly found in all four locations. The inclusion of the humpback whale sounds – mostly songs associated with mating in the southern waters, and feeding or social calls in the northern waters – gives researchers a way to compare the sounds of biological resources across all the soundscapes, Haver said.
The researchers found that ambient sound levels varied across all four study sites and sound levels were driven by differences in animal vocalization rates, human activity and weather. The highest sound levels were found in Stellwagen Bank during the winter/spring, driven by higher animal sound rates, vessel activity and high wind speeds. The lowest sound levels were found in Glacier Bay in the summer.
“Generally, the Atlantic areas were louder, especially around Stellwagen, than the Pacific sites,” Haver said. “That makes sense, as there is generally more man-made sound activity in the Atlantic. There also was a lot of vessel noise in the Caribbean.”
The researchers also were able to hear how sound in the ocean changes before, during and after hurricanes and other severe storms; the monitoring equipment captured Hurricanes Maria and Irma in the Virgin Islands and Tropical Cyclone Winston in American Samoa. Ultimately, the study provides a baseline for these four regions and can be used for comparison over time. Documenting current and potentially changing conditions in the ocean soundscape can provide important information for managing the ocean environment, particularly in and around areas that have been designated as protected, Haver said.
This story was originally posted by Oregon State University: https://today.oregonstate.edu/news/underwater-soundscapes-reveal-differences-marine-environments
Learn more about PMEL's work with NOAA and National Park Service's Noise Reference Station here: https://www.pmel.noaa.gov/acoustics/noaanps-ocean-noise-reference-station-network