What's New Archive
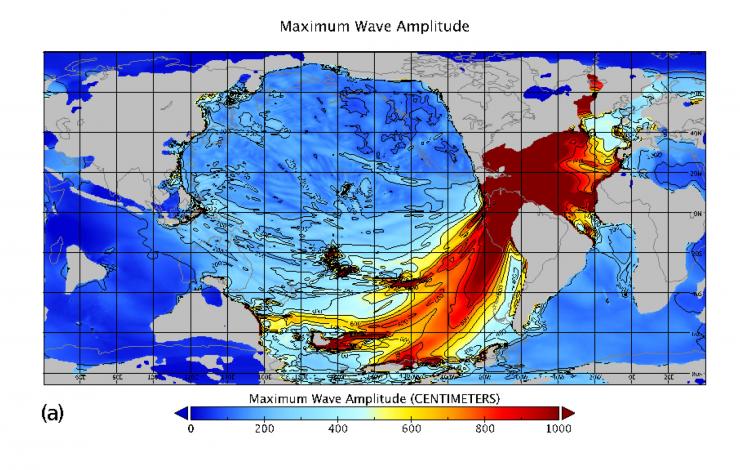
Maximum tsunami wave amplitude, in centimeters, following the asteroid impact 66 million years ago. Credit: From Range et al. in AGU Advances, 2022.
The 6+ miles-wide asteroid that struck Earth 66 million years ago wiping out nearly all the dinosaurs and roughly three-quarters of the planet’s plant and animal species also triggered a megatsunami with mile-high waves that new research confirms its global impact.
A new study, published today in the journal AGU Advances, presents the first global simulation of the Chicxulub asteroid impact tsunami. An international group of researchers from academic institutions and government agencies, including NOAA’s Pacific Marine Environmental Lab and Geophysical Fluid Dynamics Lab combined numerical modeling and analysis of geological records to recreate global impact of the tsunami generated by the impact.
Simulation of the megatsunami triggered by the asteroid has provided unlikely verifications for numerical models and improves our understanding of the geology of this period.
Numerical analysis of the event used three different models to reproduce tsunami generation and propagation. A large computer program that models details of complex fluid flows, called a hydrocode, simulated the first 10 minutes of the tsunami generation, and two NOAA-developed models were then used to simulate the tsunami propagation around the global ocean. Additionally, the research team reviewed the geological record at more than 100 sites worldwide and found evidence that supports the models’ predictions of the tsunami’s path and power – a remarkable verification of the model for the megatsunami event of 66 million years ago.
“This tsunami was strong enough to disturb and erode sediments in ocean basins halfway around the globe, leaving either a gap in the sedimentary records or a jumble of older sediments,” said lead author Molly Range, who conducted the modeling study for a master’s thesis at the University of Michigan.
The study authors calculated that the initial energy in the tsunami was up to 30,000 times larger than the energy in the December 2004 Indian Ocean earthquake tsunami, which killed more than 230,000 people and is one of the largest tsunamis in the modern record.
“Our study is the first estimate of the global impact of the tsunami generated by the Chicxulub asteroid,” said Vasily Titov, co-author of the study. ”The models estimate that virtually all world coastlines experienced catastrophic flooding from that tsunami.”
Depending on the geometries of the coast and the advancing waves, most coastal regions would be inundated and eroded to some extent.
The team’s simulations show that in some deep-water basins of the North Atlantic, the Pacific and in some adjacent areas, underwater current speeds likely exceeded 20 centimeters per second (typically less than 1 cm per second for an earthquake-generated tsunami), a velocity that is strong enough to erode fine-grained sediments on the seafloor.
In contrast, the South Atlantic, the North Pacific, the Indian Ocean and the region that is today the Mediterranean were largely shielded from the strongest effects of the tsunami, according to the team’s simulation. In those places, the modeled current speeds were likely less than the 20 cm/sec threshold.
“We found corroboration in the geological record for the predicted areas of maximal impact in the open ocean,” said Brian Arbic, co-author and physical oceanographer at University of Michigan . “The geological evidence definitely strengthens the paper.”
For the current study, the researchers did not attempt to estimate the extent of coastal flooding caused by the tsunami. A follow-up study is planned to model the extent of coastal inundation worldwide by PMEL’s Vasily Titov.
Any modern documented tsunamis pale in comparison with this global catastrophic event, about 30,000 times smaller than this megatsunami. This study helps to assess and quantify the risk of future large asteroid impacts. In addition, the ability to reproduce mega-events like this is an important validation for the models to be able to forecast global impacts of more conventional tsunamis that humanity has to deal with.
Read the full University of Michigan Press Release for more details.
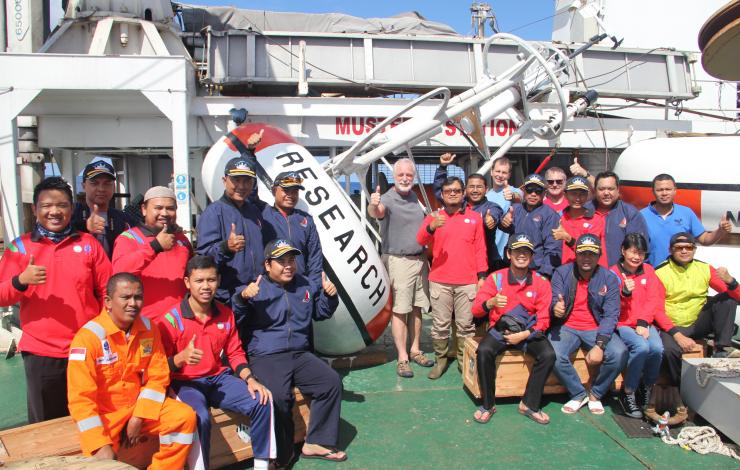
Indonesia BMKG and NOAA scientists participating on a joint RAMA cruise (February - March 2017) in the Indian Ocean aboard the Indonesian Research Vessel Baruna Jaya-VIII.
On July 29, 2022, representatives from NOAA and the Indonesian Meteorology, Climatology, and Geophysical Agency (BMKG; Badan Meteorologi, Klimatologi, dan Geofisika) signed an updated Memorandum of Understanding (MOU) that extends the partnership agreement between NOAA and BMKG for five more years. This renewed MOU marks 17 years of successful long-term partnership that was first established in 2005 and later formalized with the signing of the first MOU in 2012.
This bilateral partnership leverages mutually beneficial resources that strengthen our combined capabilities in ocean and atmospheric observations for improved weather and climate prediction. Some of the highlights of this partnership include delivery of improved information for regional climate decision support services, PhD opportunities in the US for Indonesian students, training and capacity building opportunities for Indonesian scientists at NOAA's Climate Prediction Center (CPC) International Climate Desk, jointly conducted RAMA related field work on Indonesian research vessels in the Eastern Indian Ocean, and annual BMKG-NOAA Partnership Science Workshops.
PMEL provides all the equipment, instrumentation, technical capacity building, and data services for moorings deployed in RAMA. PMEL also provides support for PhD students, participates in the annual partnership workshops, and participates on the annual joint BMKG-NOAA RAMA cruises aboard the Indonesian research vessels to deploy up to five RAMA moorings per year.
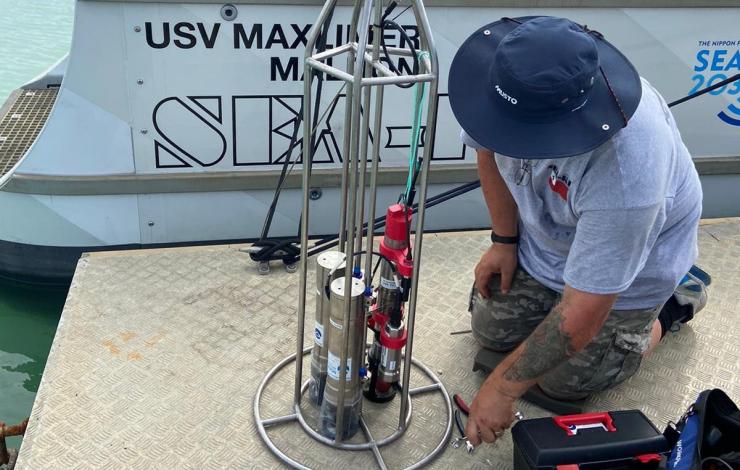
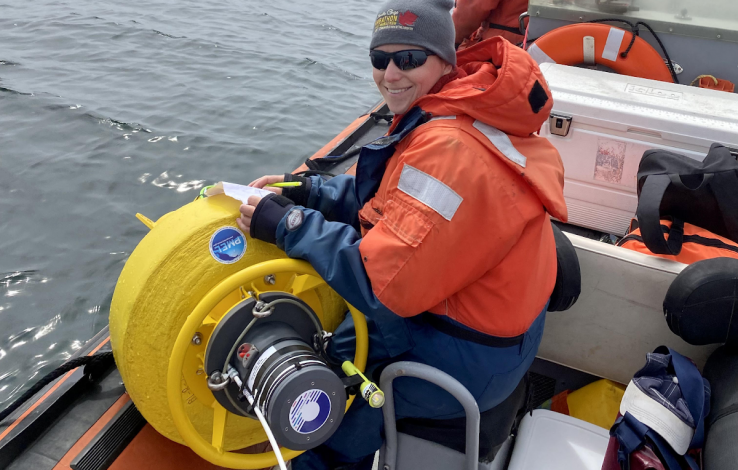
SeaKit engineer on the dock in Tonga mounting the PMEL MAPRs onto a specifically designed cage to fit on the USV Maxlimer. Click on the image to enlarge. Photo Credit: Sea-Kit International/NIWA/Nippon Foundation
July – August 2022: PMEL's Sharon Walker joined a team of engineers, multibeam mapping experts, and scientists from around the globe to complete a high-resolution bathymetric and hydrothermal plume survey of the post-eruption caldera at the Hunga Tonga-Hunga Ha’apai (HTHH) volcano. This is the first time a survey that includes direct measurements of the water column up to 300 meters deep has been conducted entirely remotely using an uncrewed surface vessel operated and monitored by engineers and scientists who are located across the globe.
As part of the Tonga Eruption Seabed Mapping Project (TESMaP), PMEL provided Miniature Autonomous Plume Recorder (MAPR) instruments to determine the level of ongoing volcanic and hydrothermal activity within the caldera. A winch and custom built frame were added to the uncrewed surface vessel (USV) Maxlimer from Sea-Kit International Ltd to house and deploy the MAPRs and a small CTD. To date, 24 vertical casts and 9 tow-yo’s have been successfully completed. The USV Maxlimer is also equipped with a multibeam echo sounder to acoustically measure depth and state of the seabed.
The powerful eruption of HTHH on January 15, 2022 caused devastating tsunamis in Tonga and an unprecedented air pressure wave that circled the globe. Data about these impacts was quickly available from a range of ocean and atmosphere observing systems including satellites, tide gauges, DART tsunami systems, weather stations, Saildrone uncrewed surface vehicles, and human observations. The impact of the eruption on the ocean environment included observations of pumice rafts and discolored water dispersing at the surface. Knowing what happened deep beneath the surface of the ocean was harder to understand and is important for determining the level of ongoing risk from this volcano.
Results show the caldera was excavated to a depth of 850 meters by the eruption, which is 700 meters deeper than pre-eruption. MAPR sensors have confirmed that there is ongoing activity within the caldera, though it could be due to continuing eruption at a reduced intensity, hydrothermal venting driven by cooling lava, or both. The distribution and thickness of ash deposits on the flanks of the volcano outside the caldera were mapped during phase 1 of the project, along with the collection of seawater, rock, and sediment samples, in April by New Zealand’s National Institute of Water and Atmospheric Research (NIWA) R/V Tangaroa. This project is funded by the Nippon Foundation, in partnership with NIWA and Seabed 2030, with additional support and collaboration on MAPR results from GNS Science.
The USV Maxlimer is being operated from Sea-Kit’s command center in Essex, UK (over 16,000 miles from the study site), the survey team has been working from places as far and wide as Australia, Poland, Egypt, Ireland, Mauritius, Seattle (USA) and New Zealand.
Learn more about PMEL's effort to understand this unique event and NOAA's technological innovation effort.
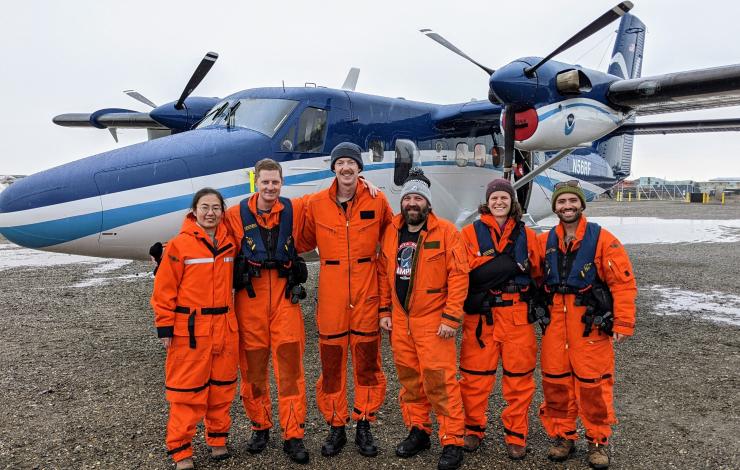
The team of NOAA and University of Washington Cooperative Institute scientists during the first flight mission over Alaskan waters to conduct renewed research on Arctic ocean heat flows.
July 29 - August 4: A team of NOAA and University of Washington Cooperative Institute scientists flew over Alaskan waters to conduct renewed research on Arctic ocean heat flows. Scientists deployed 30 floats from NOAA aircraft that will provide key temperature data to better understand how the Arctic ocean is warming.
The team completed the second leg of the 2022 mission from the northernmost point of Alaska, Utqiagvik. They deployed 24 temperature profilers, Airborne eXpendable Bathy Thermographs (AXBTs), in groups of six along four different sections of an ocean slope region. AXBTs are small probes that measure ocean temperature as a function of depth as they travel through the water column. The ocean floor contains a narrow channel where warm water flows into the Arctic, eventually splitting into two flows moving left and right. The goal of this research is to measure the water temperature along this slope and determine the total heat content that each pathway is guiding, including how much of that heat moves in each direction. Determining the heat flow (in both directions) provides important information that contributes to sea ice formation and retreat, as well as effects on downstream algal blooms.
In June, the team began the first flights from Prudhoe Bay to Kotzebue and deployed eight floats that measure ocean temperature to support data collection efforts of the Distributed Biological Observatory. The team deployed 8 AXBTs that will provide critical data in this undersampled area for the next few years. 2 of the 8 floats are transmitting ocean temperature data and measurements were collected between sampling locations.
This work is a fresh take on efforts established by the late Dr. Kevin Wood. Dr. Wood was deeply committed to understanding and communicating the nuances of science in a way that inspired and motivated people to work to mitigate climate change. To continue his legacy, special funding was brought together from NOAA PMEL, NOAA OMAO, and the University of Washington CICOES to support these flights.
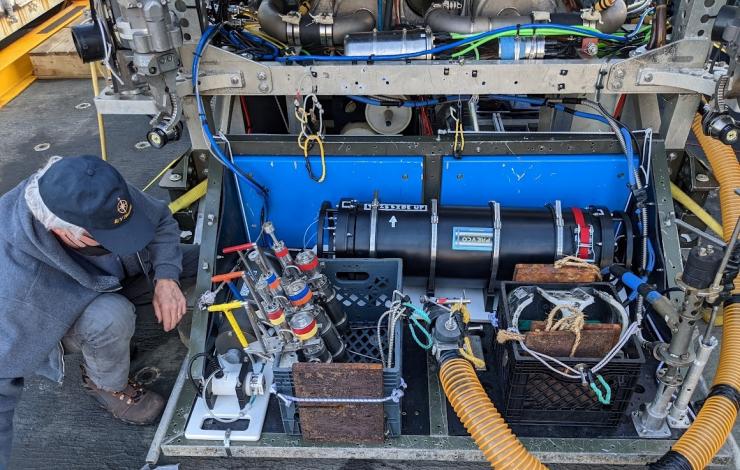
Dave Butterfield checking fluid connections to the methane spectrometer (large black pressure case) mounted at the back of ROV Jason’s tool sled. Other equipment used on this dive include the auxiliary pump at left, 3 titanium gas-tight sampler with colored T-handles, a suction sampler (large orange hose) and the Hydrothermal Fluid Sampler intake nozzle at far right. Photo Credit: Andrew Fahrland (OKSI)
NOAA PMEL, University of Washington and OptoKnowledge Systems, Inc. (OKSI) successfully conducted the first deep water test of a new methane analyzer to measure the concentration and carbon isotope ratio of methane near Axial Seamount. This new instrument can collect data that will improve scientists’ understanding of carbon cycling, greenhouse gasses, and sub-seafloor chemosynthetic reactions.
After 3 years of testing and development, the analyzer was mounted on the remotely operated vehicle Jason and coupled to PMEL’s hydrothermal fluid and particle sampler (HFS) during a recent cruise on the Research Vessel Thompson. The methane analyzer combines a novel laser absorption spectroscopy gas sensor with a membrane-free approach to water sampling. While the research cruise had to be cut short, the team successfully was able to collect valuable data and coordinate samples for cross-calibration during one ROV dive.
While collecting data with the methane analyzer, researchers simultaneously sampled the same fluid in gas-tight samplers attached to the fluid manifold and in custom samplers that are part of the HFS. Methane concentrations analyzed onboard the R/V Thompson by gas chromatography on fluid samples from HFS piston and bag samplers agree well with the in-situ methane concentrations determined by the analyzer.
Ultimately, the instrument worked well on the ROV and it is expected that the methane spectrometer will have many useful applications.
Learn more about this technology development and methane work on PMEL’s Earth Ocean Interactions research page.
Instrument Development:
The methane analyzer was developed by OKSI with initial funding from the NOAA Small Business Innovation Research (SBIR) Program. The SBIR Program, also known as America’s Seed Fund, awards seed funding to U.S. small businesses to support high-risk, high-reward research and development of new technologies. In 2016, OKSI received a NOAA SBIR Phase I award to develop an instrument that could analyze underwater gasses, specifically methane and its isotopes. The company was awarded follow-on Phase II funding in 2017.
The effort has since transformed into a Phase III collaboration with PMEL. OKSI and NOAA PMEL were funded in 2019 through a National Ocean Partnership Program (NOPP) grant with NOAA Ocean Exploration support to continue development of the methane spectrometer and deploy it in deep water. In 2021, PMEL and OKSI successfully completed shallow-water methane concentration measurements in Puget Sound. The Puget Sound test showed that the instrument can take measurements of methane concentration in-situ and report those measurements in real-time to an operator on board a ship with an update rate approximately every 6 minutes.
More About the Sensor:
For the new spectrometer instrument, it is important to verify that the in-situ measurements agree with established discrete sampling and analysis for methane concentration and carbon isotope ratio. The PMEL hydrothermal fluid sampler, first developed in 1998, will deliver warm hydrothermal fluids from diffuse vents with elevated methane concentrations to the methane spectrometer and simultaneously take coordinated discrete samples for laboratory analysis of concentration and carbon isotope ratio to cross-calibrate the in-situ measurements from the methane sampler. Tamara Baumberger is collecting samples in specialized gas-tight samplers for carbon isotope and methane concentration analysis.
FOCI mooring ready for deployment in the Bering Sea aboard the NOAA Ship Oscar Dyson. The M2 surface mooring that has been deployed each spring in the southeastern Bering Sea for over 25 years. This critical mooring provides year-round measurements of temperature, salinity, nitrite, chlorophyll, and currents in this highly productive area. For the last 10 years, partial pressure in CO2 (pCO2) and pH measurements have also been taken at M2.
An annual survey is underway to provide baseline fisheries and oceanographic data to support sustainable management of living resources in the Bering Sea and the rapidly changing US Arctic ecosystem. These surveys provide key data in understanding and monitoring events such as sea-ice loss and the cold pool and how these are impacting the Arctic ecosystem.
This spring mooring cruise brings together scientists from NOAA’s PMEL and Alaska Fisheries Science Center, University of Washington, US Fish and Wildlife, and the University of Alaska. While aboard the NOAA Ship Oscar Dyson, the scientists will service a biophysical mooring array in the Bering Sea, collect conductivity, temperature, depth (CTD) profiles, zooplankton and ichthyoplankton samples and conduct special projects related to harmful algal blooms and zooplankton machine learning. Results from these observations and experiments will help describe important ecosystem linkages among climate, plankton, fishes, birds and mammals.
EcoFOCI will be field testing and using several technologies this summer, including pop-up floats, a remote access sampler and a new shallow-water glider. These technologies aim to enhance shipboard and mooring research with more data collection in a fine scale region.
NOAA’s EcoFOCI program is leading 5 research cruises this March to October in the Alaska region.
Find blog updates on the NOAA Alaska Fisheries Science Center webpage: https://www.fisheries.noaa.gov/region/alaska#science
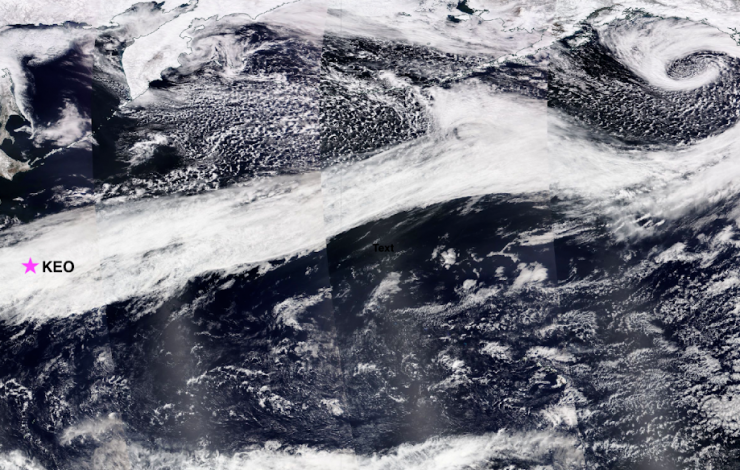
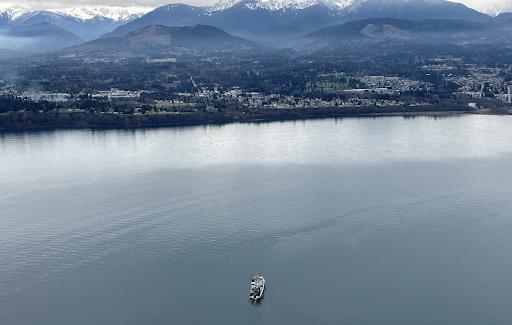
The KEO moored buoy (pink star) was deployed just in time to observe an intense atmospheric river (as shown in the satellite image) that connected the western Pacific to the east and brought stormy weather and heavy precipitation to the Pacific Northwest. Click on image to see full image. Cloud image created from worldview.earthdata.nasa.gov
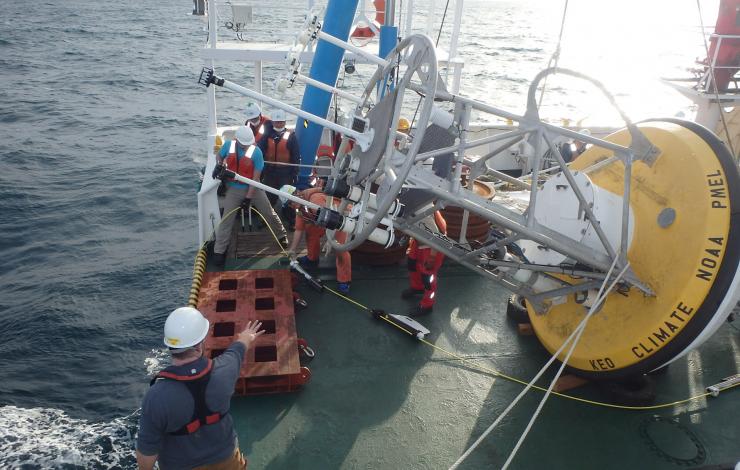
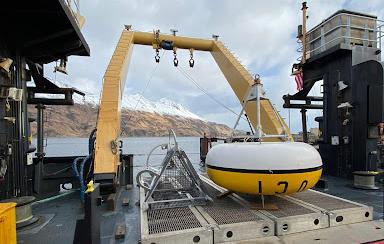
The KEO Climate Station deployment aboard the R/V Kiayo Maru #1 took about 6 hours. Data from this key climate observation moored buoy can be used to help improve weather and storm forecasts, inform climate projections and verify satellite products and models. Photo Credit: Patrick Berk/University of Washington and NOAA PMEL
March 31, 2022: The Kuroshio Extension Observatory (KEO) moored buoy was successfully deployed by NOAA PMEL and partners, renewing an ongoing OceanSITES time series that began almost 18 years ago. First deployed in 2004, its time series was disrupted by the COVID pandemic. KEO collects vital data in the Kuroshio Extension recirculation gyre, a region known to affect the development of storms over the North Pacific before they reach the United States.
The deployment was just in time for KEO to capture the air-sea interaction process underneath an intense atmospheric river that connected the western Pacific to the east and brought stormy weather and heavy precipitation to the Pacific Northwest.
KEO carries sensors for NOAA PMEL and partners from Japan and US academic institutions that measure surface air-sea heat and momentum fluxes, along with various oceanographic variables in the upper 525 meters and near the seafloor. New this year, the KEO-2022 mooring includes dissolved oxygen sensors, a nitrate sensor, and a testbed for new biodegradable “plastic-alternative” materials from the Japan Agency for Marine-Earth Science and Technology (JAMSTEC), the University of Washington-Applied Physics Lab’s bubble and acoustic observations, and a moored CO2 system.
KEO will also play a critical role in the Japanese national program “Middle-latitude atmosphere-ocean interaction hotspot in a changing climate system” (HotSpot-2), as an ocean observatory by providing a reliable platform for new sensors and the long-term, large-scale context of intensive field campaign observations.
Learn more about the research part of the Ocean Climate Stations program: https://www.pmel.noaa.gov/ocs/KEO
This work is funded by NOAA’s Global Ocean Monitoring and Observing Program to sustain in situ global ocean observations and information in support of research, monitoring, and prediction.
Reviewing checklist and final preparations to deploy drifting hydrophone buoys off the coast of Oregon.
A new video highlighting PMEL's acoustics research and eDNA innovations to study Blue Whales off the coast of Newport, Oregon has been released in the “PMEL at Work” YouTube series.
This video features PMEL’s Acoustic Program’s Bob Dziak and Angela Sremba discussing ongoing research to develop technology to better understand blue whales by simultaneously collecting environmental DNA (eDNA) samples and recording acoustic calls through deploying drifting buoys with underwater hydrophones.
Over the summer of 2021, PMEL and OSU CIMERS scientists field tested three passive-acoustic hydrophones to identify and locate blue and fin whales. These new smart hydrophones have an internal microprocessor that communicates the location of the buoys to shore. PMEL developed software for the microprocessor that will analyze the hydrophone data using a blue whale call detection algorithm. The goal for this algorithm is to register a positive blue call detection and transmit this positive detection information, as well as the position of the buoy, via satellite communication to shore to let scientists know when and where a blue whale call is recorded. When a call is detected on multiple buoys, the shore based scientists can then determine the location of the calling whale, and then inform the ship’s crew that a blue whale is nearby. The location of the whale will be correlated with the results from collected eDNA samples.
This past summer was a successful field test of the hydrophone buoys in anticipation for upcoming fieldwork in the summer of 2022 where PMEL will simultaneously collect acoustic recordings and eDNA samples of blue whales off the Oregon coast. This project will improve interpretation of eDNA results by using a time-series sampling method combined with acoustic detection for tracking and localizing highly migratory whale species in remote open ocean habitats.
This is a collaborative project between Oregon State University Marine Mammal Institute and Cooperative Institute for Marine Ecosystem and Resources Studies (CIMERS) and NOAA.
The PMEL at Work video series highlights ongoing research activities and projects supporting NOAA’s mission to understand changes in the global ocean and its impact on climate, weather and ecosystems.
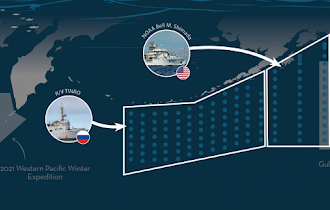
Zone map for the 2022 Pan-Pacific Winter High Seas Expedition(click on image to see the full map).Credit: NOAA Fisheries
NOAA Ship Shimada leaving Port Angeles, Washington to join the Year of the Salmon Expedition. Photo Credit: CDR Duncan/NOAA
February 1 - March 7: NOAA PMEL scientists join NOAA Fisheries and an international team of researchers aboard the NOAA R/V Shimada to provide expertise in physical oceanography and lead hydrographic data collection, nutrient sampling, analysis and processing. EcoFOCI is taking part in the International Year of the Salmon expedition to help detect and monitor changes both within Pacific salmon and their respective ecosystems, especially in the Gulf of Alaska.
Pacific salmon are a uniquely important resource for countries across the North Pacific yet there are major scientific gaps in our understanding of the ocean phase of the salmon life cycle. This cruise will collect vital data to improve that understanding and aid in forecasting and management of salmon.
The expedition will include as many as five research vessels to conduct the largest ever pan-Pacific, epipelagic ecosystem survey during winter, focused on understanding salmon and their ecosystems. The 2022 Expedition will involve a full ecosystem survey with pelagic trawling and detailed sampling of marine life in the upper ocean and will include research on physical, biological and chemical oceanography. Novel technologies such as gliders, environmental DNA and genetic stock identification will be used to enhance research efforts. This collaborative international effort spanning the entire North Pacific includes scientists from Canada, Japan, the Republic of Korea, the Russian Federation, and the United States.
The data collected by PMEL will provide key baseline and comparative data to the overall pan-Pacific collaboration focused on salmon recovery. During the expedition, PMEL will collect samples from over 30 CTD stations, deploy satellite-tracked drifters and several Argo floats, and collect carbon dioxide, nutrient and salinity measurements from an on-board flow-through system.
The research cruise will extend from 1 February to 7 March in the central to western Gulf of Alaska. More about the expedition: https://yearofthesalmon.org/2022expedition/
Follow along with the expedition on the blog and more details online: https://www.fisheries.noaa.gov/west-coast/2022-pan-pacific-winter-high-seas-expedition
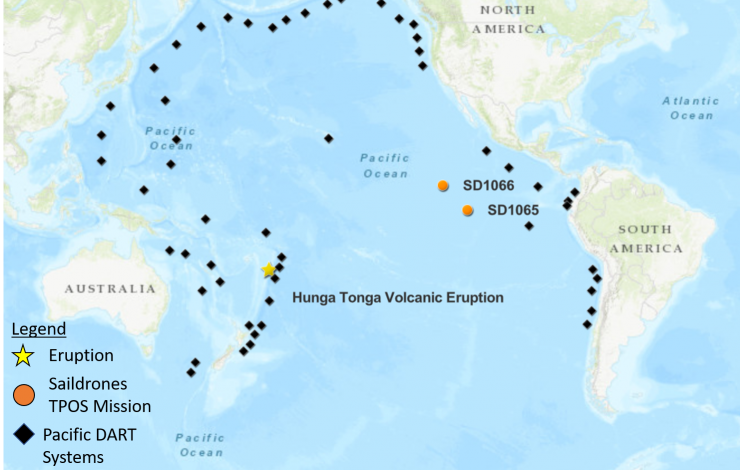
Map of the tropical Pacific showing the positions of DART buoys operated by NOAA and international partners as well as saildrone 1065 and 1066 relative to the Hunga Ha’apai Volcano located in the Pacific island nation of Tonga, which is an archipelago consisting of more than 170 islands.
On January 15, 2022, the Hunga Tonga-Hunga Ha’apai volcano erupted off the coast of Tonga in the South Pacific Ocean, generating a tsunami and triggering tsunami alerts around the world. Most tsunamis are commonly caused by earthquakes and only about 5% of tsunamis are generated from volcanic activity (ITIC), making this a rare event captured by NOAA’s observing instruments.
Buoys and Saildrone uncrewed surface vehicles additionally recorded an air pressure wave associated from the eruption. The pressure wave from the volcano explosion was detected as far as the Mediterranean Sea and traveled about 312 meters/second (697 miles per hour) and circled the Earth three times before dissipating. The Krakatau eruption in 1883 was the last event of such scale. Krakatau produced similar air pressure waves and a devastating tsunami that claimed the lives of ~36,000 people and the destruction of hundreds of coastal towns and villages.
Deep-ocean Assessment and Reporting of Tsunamis (DART) systems are strategically deployed by NOAA and international partners around the Pacific Ocean to detect tsunami waves and send data in realtime to tsunami warning centers. These systems recorded the propagating tsunami across the Pacific and prompted expansion of the tsunami alerts for many coastlines in the Pacific. Those warnings may have saved lives at many coastlines that were later flooded by the waves, some as far as the Pacific coast of Peru.
Along with the tsunami wave amplitudes measured by the DART system, the atmospheric pressure wave associated with a shock-wave emanating from the volcano explosion was measured. The air pressure signal detected by weather station buoys is the leading signature before the tsunami wave train and may provide clues for the mechanism of this unusual tsunami generation. However, given that the pressure signal mixed with the tsunami amplitudes in the data, high-resolution air pressure measurements are needed to decipher the DART tsunami records.
Coincidentally, two NOAA-Saildrone drones were approximately 3500 nautical miles (~4028 miles) away from the eruption, the distance to drive between Anchorage, Alaska and Miami, Florida, in the eastern tropical Pacific Ocean. The two drones are part of a 6-month, ongoing Tropical Pacific Observing System (TPOS) mission targeting the eastern tropical Pacific hurricane genesis region and El Niño Southern Oscillation (ENSO) development. The two drones were able to detect an atmospheric pressure jump in high-resolution measurements, capturing crucial information associated with the remote volcanic activity in an observationally-sparse region of the ocean for post-analysis with the DART tsunami records.
The phenomena recorded in the data is unique and additional research and development is needed to accommodate these types of tsunami events in the model used to forecast tsunami events. PMEL tsunami researchers are analyzing the data from the various platforms to get a better understanding of this rare event.
PMEL has also previously studied the dynamics of a smaller scale eruptive activity of this volcano using acoustic data and will uncover and analyze additional acoustic data from hydrophones deployed across the Pacific when they are recovered later this year.
Read more on the TPOS 2021 Saildrone Mission on the blog page.
More about the event can be found on the PMEL Tsunami Research group events page.