NDBC TPOS Mooring Enhancement Pilot Project
Introduction
In 2016, NOAA announced $4.5 million in funding for new observing technologies supporting ENSO research and publications. This 4-year investment is one of NOAA's contributions to advancing the Tropical Pacific Observing System Project (TPOS 2020, tpos2020.org), rethinking the ocean/marine observing system in the tropical Pacific. This observing system is critical to NOAA's mission to improve weather and climate prediction, modeling, and forecasting.
This pilot study was funded by NOAA/OAR/OOMD.
Project Description
Title: Enhanced ocean boundary layer observations on the TAO moorings
Project Leads: William Kessler (PMEL), Karen Grissom (NDBC), and Meghan Cronin (PMEL)
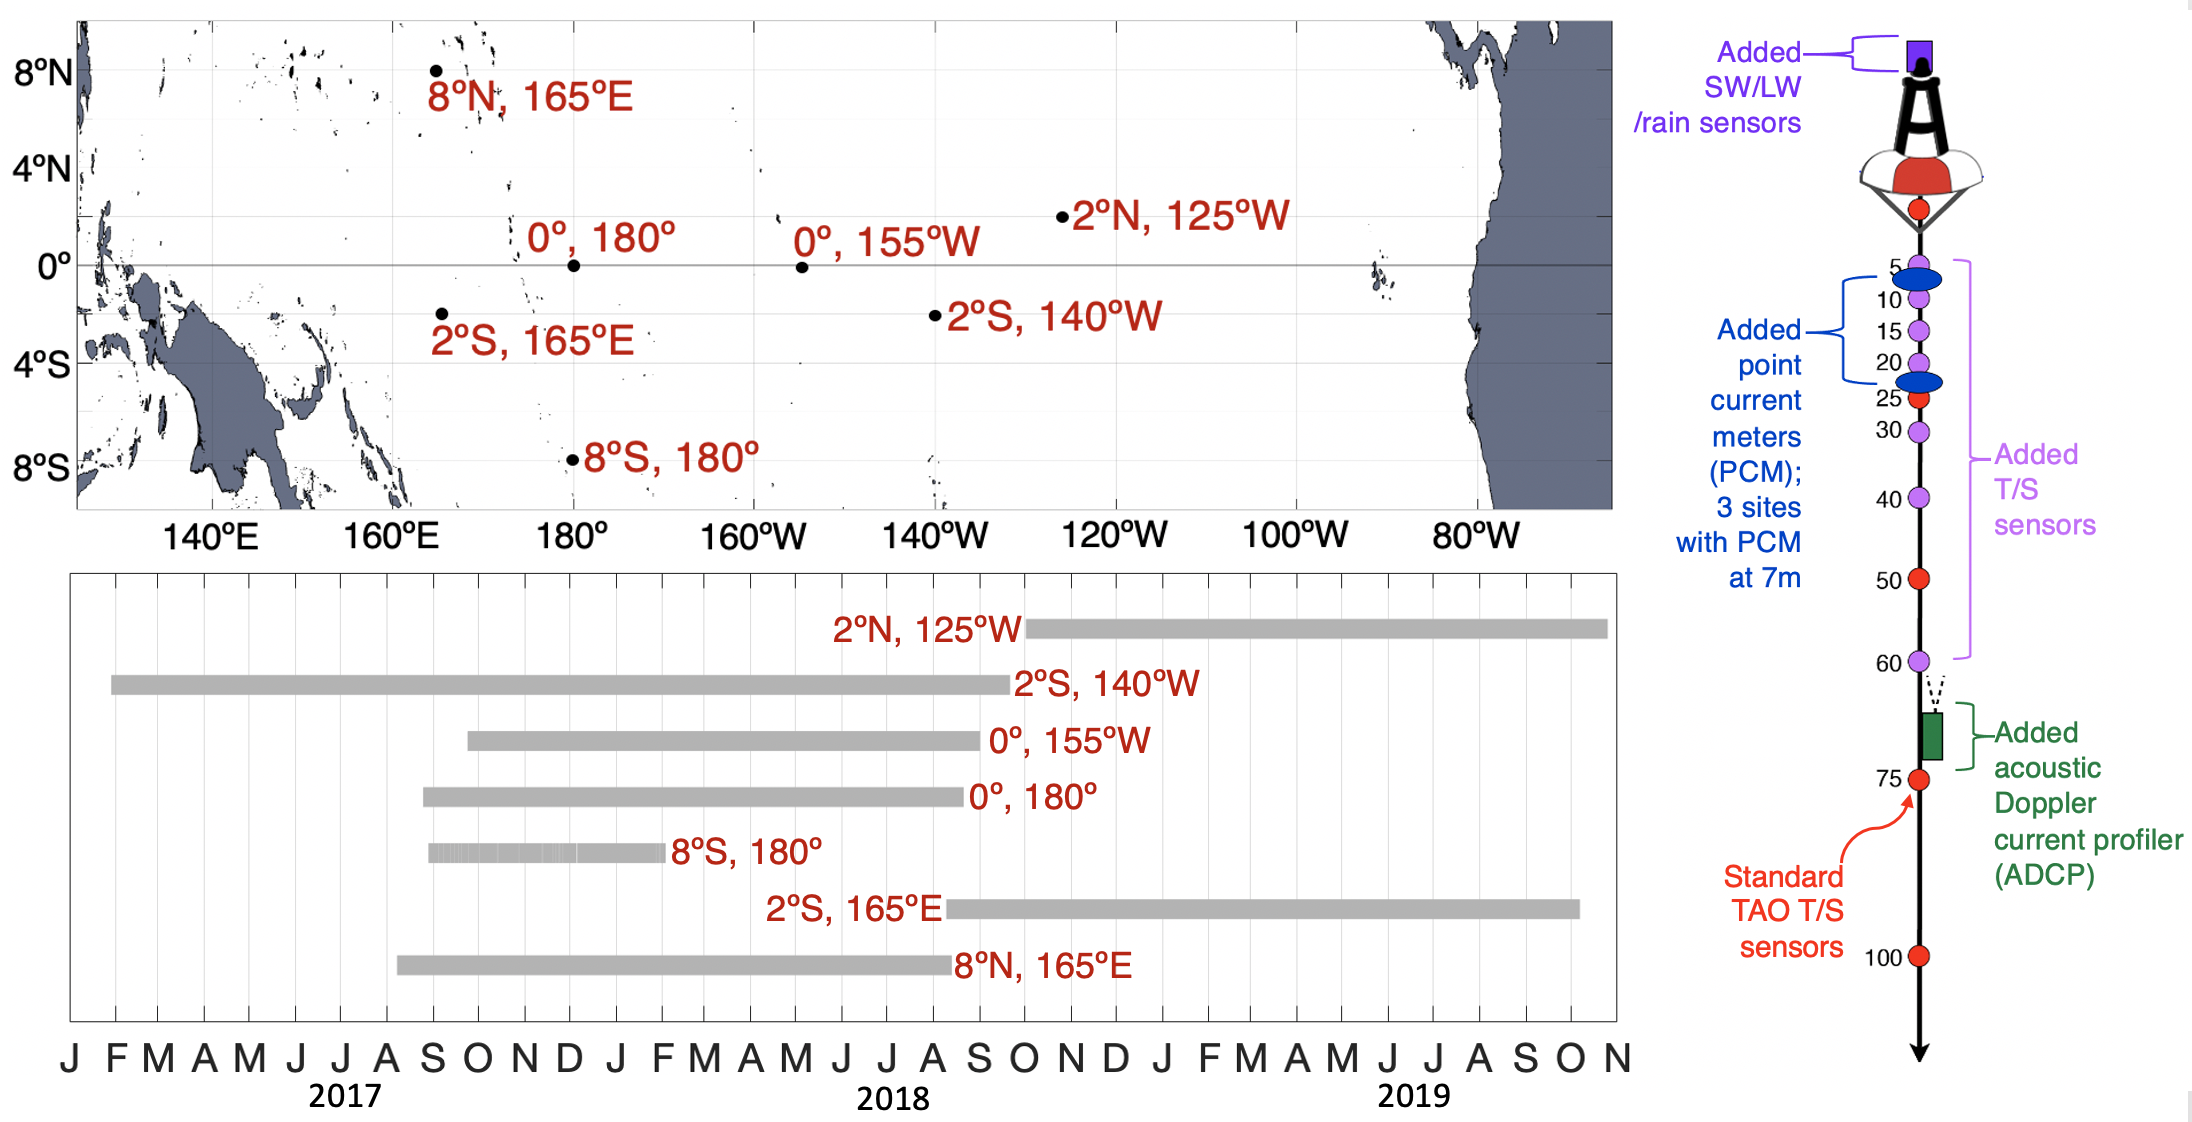
The near-surface is the “blind spot” for velocity profiles, whether measured from ships or subsurface moorings. This project from NOAA’s Pacific Marine Environmental Laboratory (PMEL) and National Data Buoy Center (NBDC) installed Acoustic Doppler Current Profilers on existing Tropical Atmospheric Ocean (TAO) moorings. These new sensors measure ocean currents in the upper 40-65 meters of the water column, where direct wind forcing of ocean currents occur.
Data Download
Hourly ADCP profiler and point current data are available in NetCDF format, by site, from the table below. Telemetered realtime data (filename includes "R"), also at hourly resolution, are provided in cases where downloaded delayed mode data (filename includes "D") are unavailable.
| 0N155W | 0N180W | 2S140W | 8N165E | 8S180W | 2N125W | 2S165E |
|---|---|---|---|---|---|---|
| Files | Files | Files | Files | Files | Files | Files |
Each site link in the table above will download a zip file including one file of the profiler data, plus a variable number of point current meter files (depending on site). Typical file sizes are 10 Mb for the profiler data and less than 1 Mb for the point current data. Each netCDF file includes velocity components and their quality control flags, beam amplitudes, and mooring metadata. Profiler velocity data is interpolated onto a regular 2-meter vertical grid. Profiler velocity data is filtered to remove surface interference of the acoustic beams based on the equation: Blanking Depth = Instrument Depth * (1 - cos(BeamAngle)) + CellSize, where blanking depth is the shallowest depth of good data, around 8 meters depth at most sites.
User beware that no further quality control has been performed beyond what has been described above, and please get in touch with any questions. Data from additional sites will be added as it becomes available. Corresponding temperature, salinity, and meteorological data are available at https://www.pmel.noaa.gov/tao/drupal/disdel/.


