


Featured Pub_Arroyo_v2.png
Image
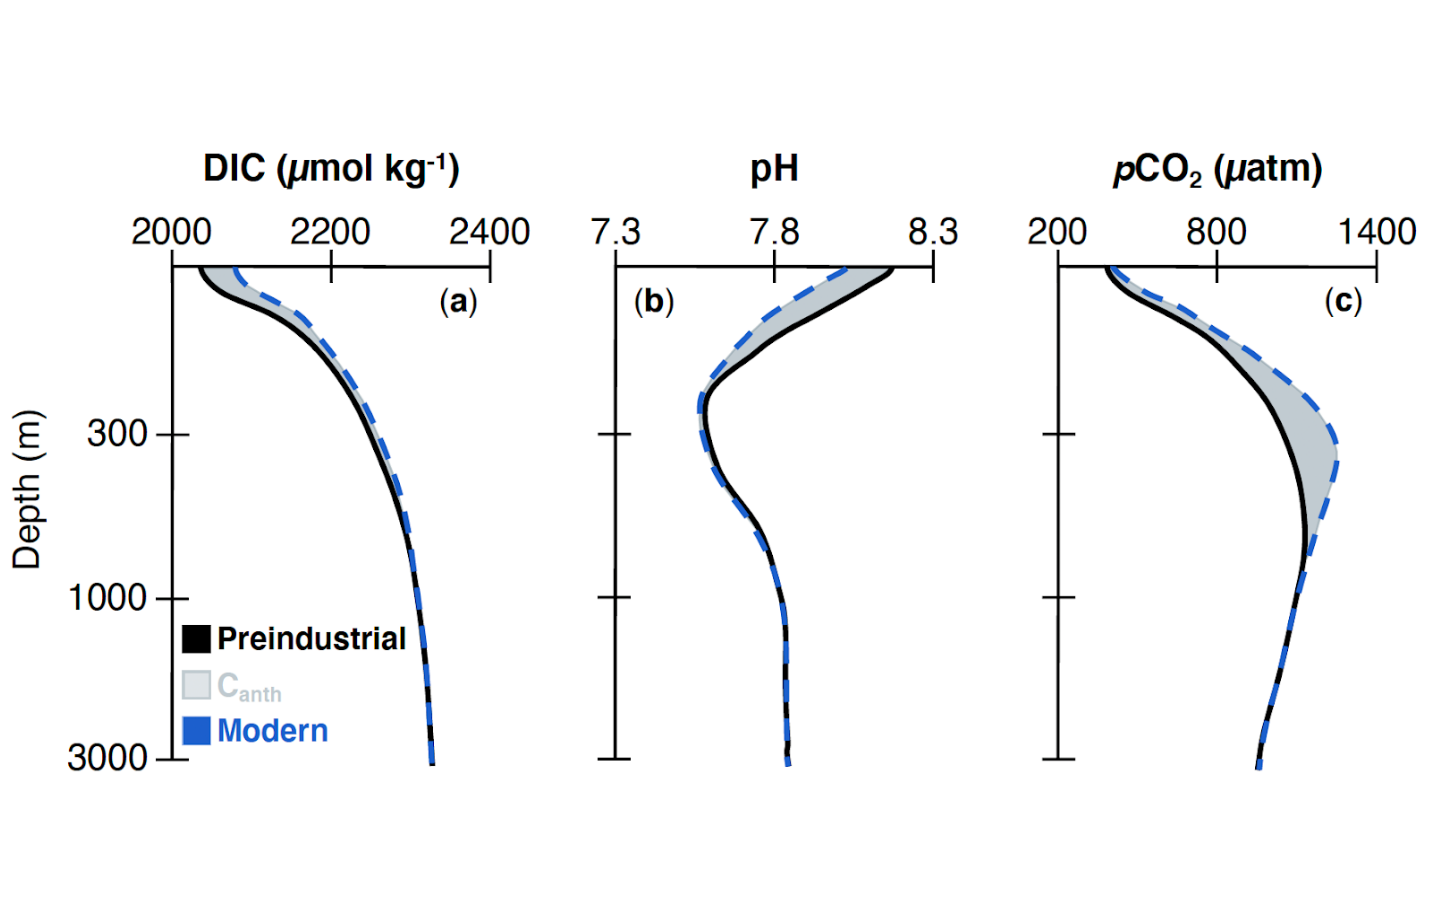
The modern ocean (blue dashed profiles) reflects the combination of natural, preindustrial conditions (black profiles) and human-induced changes (gray shading). (a) Dissolved inorganic carbon (DIC; µmol kg-1) has increased most near the surface where the ocean absorbs CO2 from the atmosphere. This has caused measurable and distinct changes in (b) pH and (c) pCO2 (µatm). Click on image to enlarge.