Sulfur Hexafluoride (SF6)
Recent efforts (supported by NOAA’s Climate Program Office) have allowed development of techniques for simultaneously measuring dissolved Sulfur Hexafluoride (SF6) along with CFCs in the same water sample. These techniques are now being used routinely as part of the CLIVAR/GO-SHIP Repeat Hydrography Program.
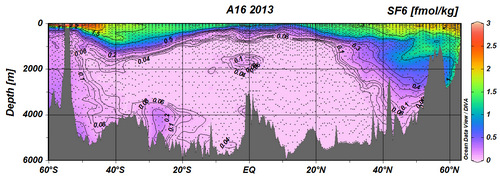
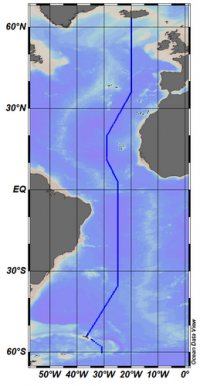
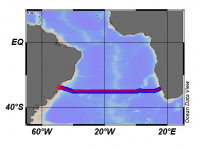
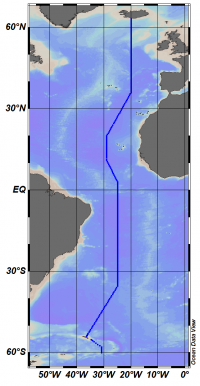
Shown below are SF6 concentrations from the North-South transect A16 (2013) and the East-West transect A10 (2011).
In addition to the input from the atmosphere, SF6 has been used as a tracer of diapycnal mixing rates in ocean by deliberately releasing the compound along selected isopycnal surfaces in several major ocean basins. The bottom maximum seen along the A10 section at about 30°S from 30°W to about 10°W in 2011 is due to a SF6 release experiment in 1996 (Ledwell, et al, 2000).
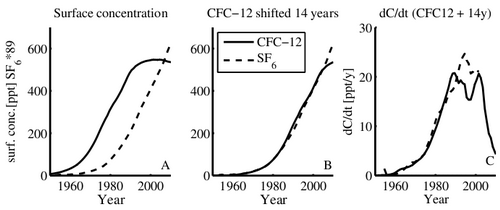
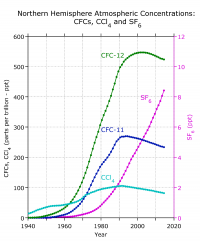
The SF6 transient in the atmosphere lags that of CFC-12 by about 15 years, providing a new tool to directly compare changes in ventilation rates over this interval. The figure above shows:
(A) Time series of the northern hemisphere surface concentrations (expressed as partial pressure in parts per trillion) of CFC-12 (solid) and SF6 (dashed) in equilibrium with the atmosphere,
(B) The CFC-12 curve is shifted +14 years to demonstrate the similarities of the two curves,
(C) The growth rate of SF6 and CFC-12 (shifted 14 years).
The SF6 concentrations are scaled by a factor of 89 in all panels (Tanhua, et. al. 2013)
References:
- Ledwell, J. R., E. T. Montgomery, K. L. Polzin, L. C. St. Laurent, R. W. Schmitt, and J. M. Toole (2000), Evidence for enhanced mixing over rough topography in the abyssal ocean, Nature, 403(6766), 179–182, doi:10.1038/35003164.
- Tanhua, T., D.W. Waugh, and J.L. Bullister (2013): Estimating changes in ocean ventilation from early 1990s CFC-12 and late 2000s SF6 measurements. Geophys. Res. Lett., 40(5), doi: 10.1002/grl.50251, 927–932
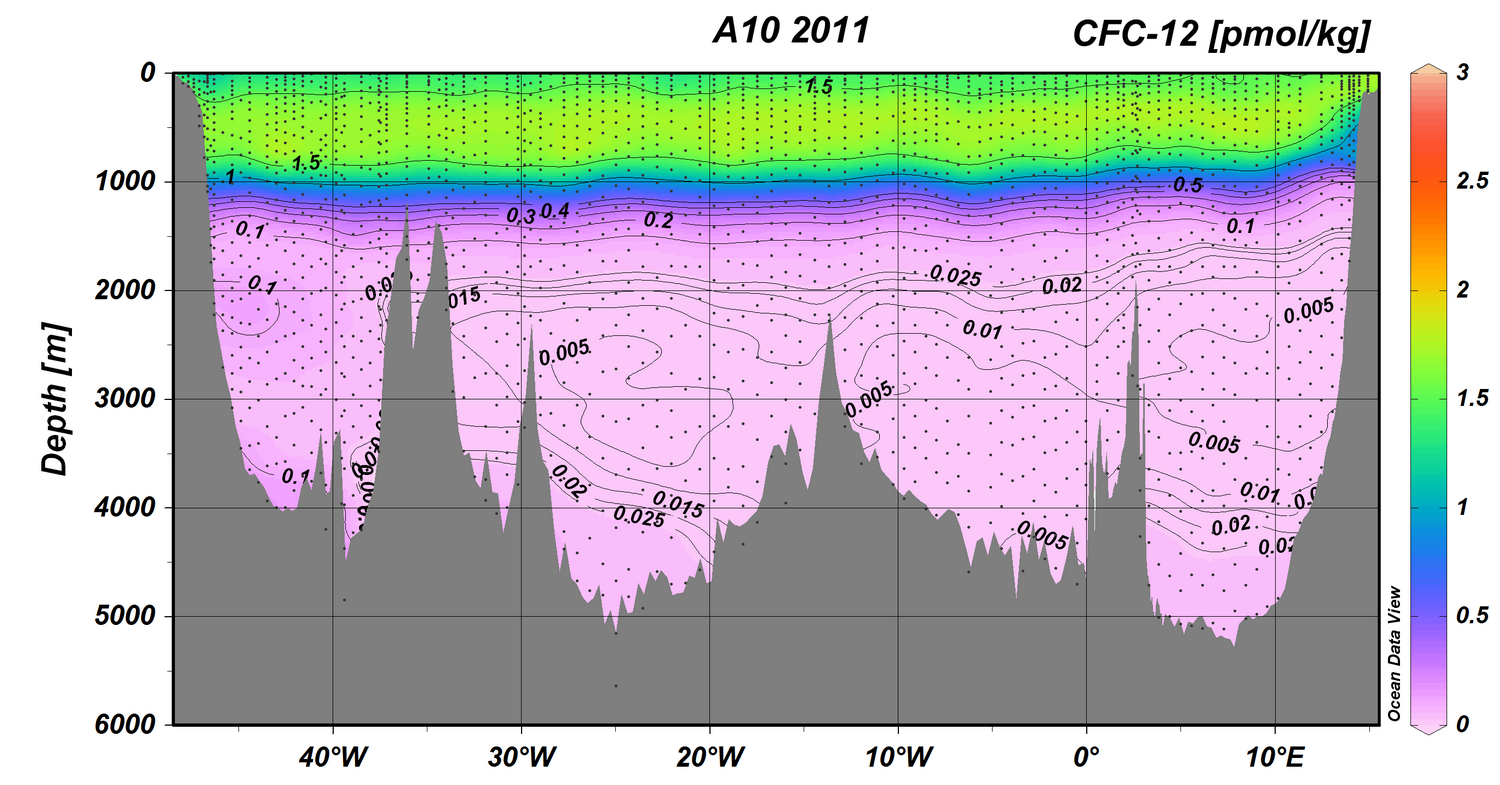
CFC-12 on A10 from 50°W to 15°E in 2011
Chlorofluorocarbon Tracer CFC-12 measured along the CLIVAR A10 section line along 30°S from 50°W to 15°E in 2011, from the surface to a depth of 6000 meters Click the image to the right to see a map with the east-west section line.
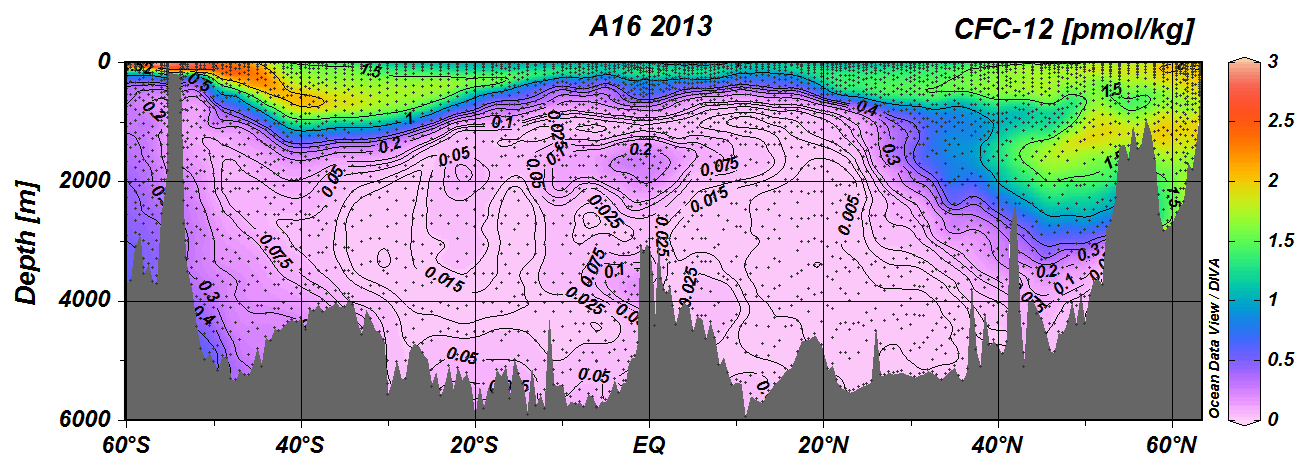
CFC-12 on A16 fro 65°N to 60°S in 2013
Chlorofluorocarbon Tracer CFC-12 measured along the CLIVAR A16 section line from 60°N to 60°S in 2013, from the surface to a depth of 6000 meters Click the image to the right to see a map with the north-section line.


