Solomon Sea Transport
Data
Latest update (May 2020)
Transport
- Solomon Sea transport (section-mean and low-pass monthly, text file): [SolomonSea_bysection.txt] (10 KB) [SolomonSea_lowpass.txt] (11 KB)
- Solomon Sea transport (section-mean and low-pass monthly, zipped NetCDF file): [SolomonSea_Transport.nc.zip] (14 KB)
Included variables are: cross-Sea integrated total and geostrophic transport (Sv) for all available coast-to-coast sections, in individual section-mean and interpolated monthly values, low-pass filtered (5-month triangle) and used to define interannual anomalies (see description in Methodology).
How to cite
- Full data set of glider measurements including temperature and salinity profiles, and vertically-averaged absolute velocity:
Davis, R. (2016). Solomon Sea Ocean Transport from Gliders [Data set]. Scripps Institution of Oceanography, Instrument Development Group. doi: 10.21238/S8SPRAY2718 - Transport time series shown on this webpage:
Kessler, W.S. and H.G. Hristova (2019). Solomon Sea volume transport time-series measured by glider [Data set]. Scripps Institution of Oceanography, Instrument Development Group. doi: 10.21238/S8SPRAY2718A
Reference
Kessler, W.S., H.G. Hristova and R.E. Davis, 2019: Equatorward western boundary transport from the South Pacific: Glider observations, dynamics and consequences. Progress in Oceanography, 175, 208-225, doi: 10.1016/j.pocean.2019.04.005
Corresponding author's email (ask for copy of paper): william.s.kessler@noaa.gov
Methodology
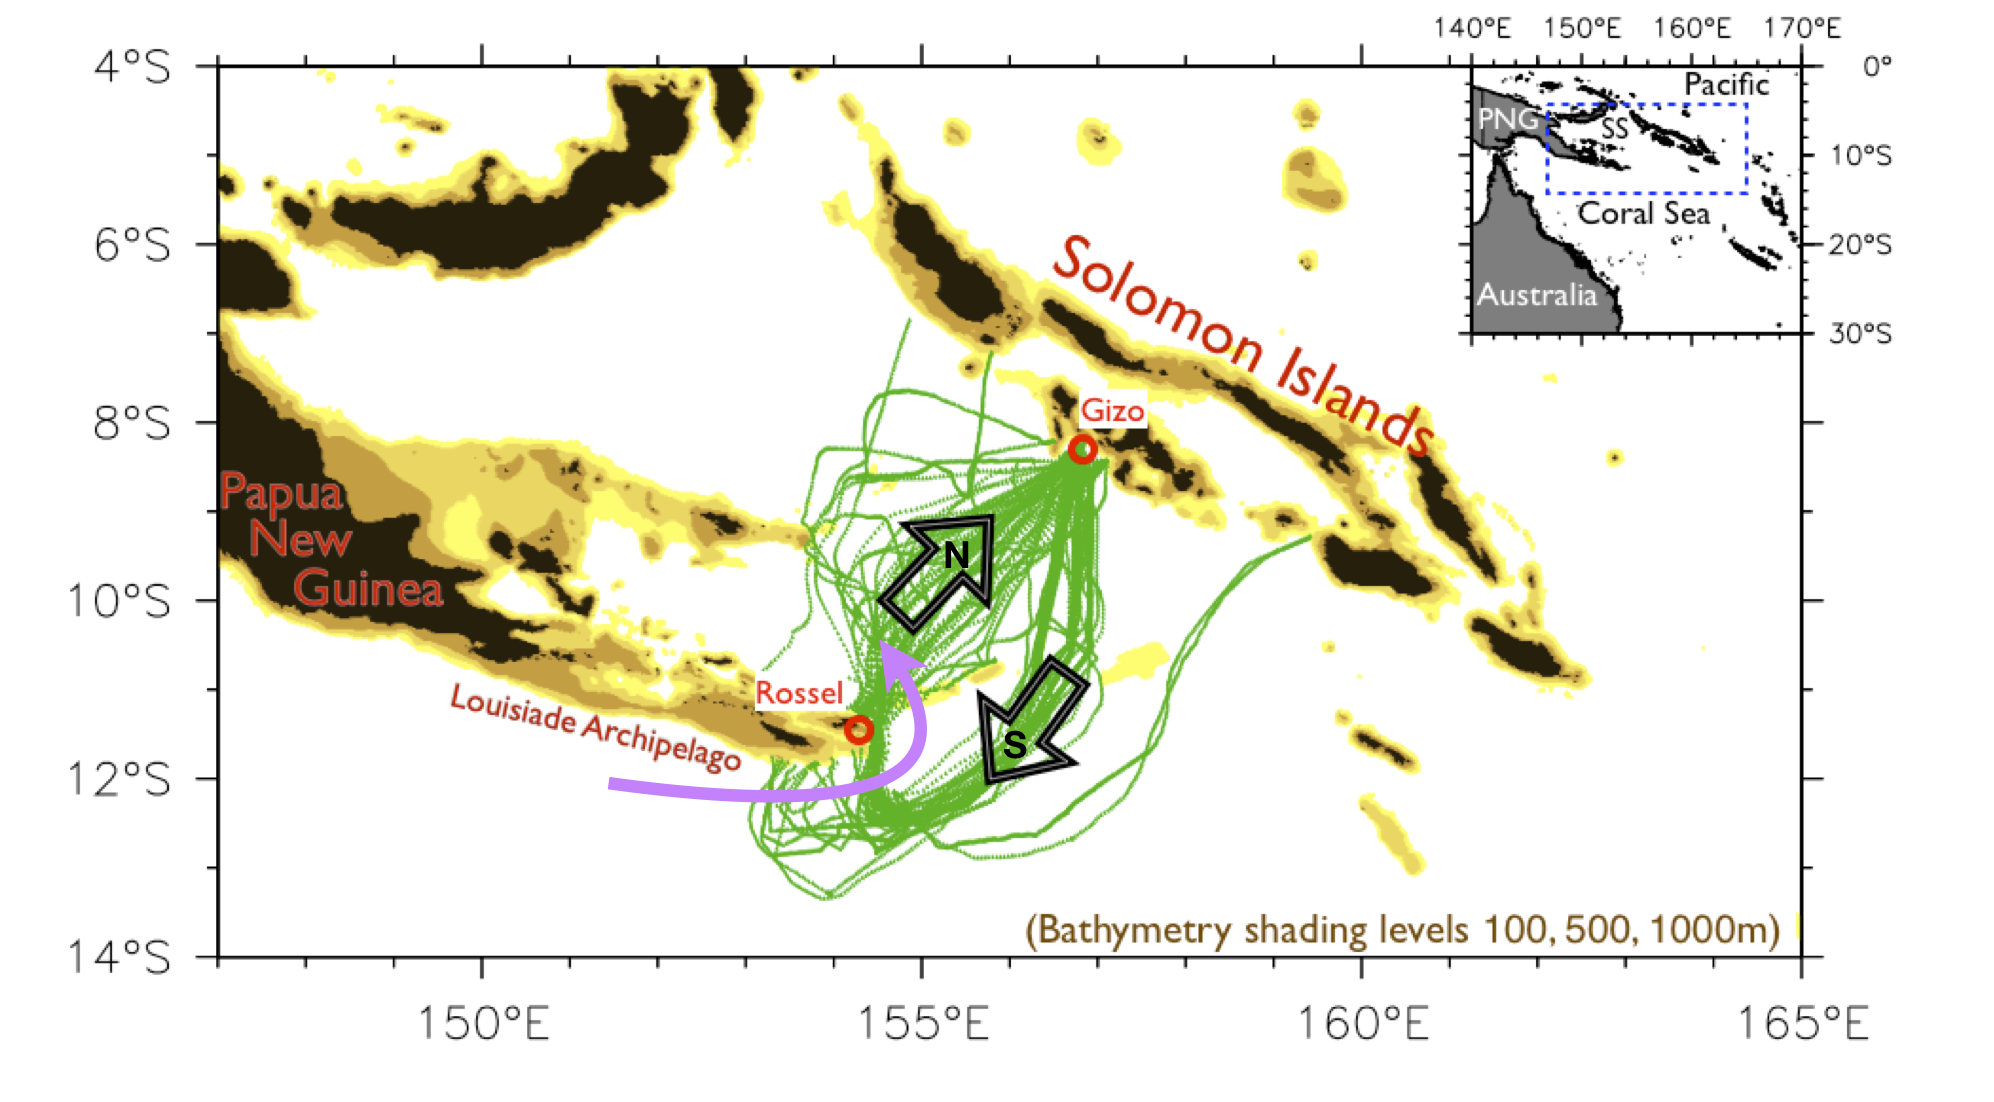
For the transport calculations, only the segments of missions spanning the distance between Rossel and Gizo are considered. A mission includes between 1 to 4 cross-sections across the mouth of the Solomon Sea. In the text file above, these sections are labels with “a, b, c, d” after the mission name. Both northern and southern tracks are included in the time-series.
The transport for each section is computed as the coast-to-coast integral of the absolute cross-track geostrophic velocity, obtained from the glider-measured temperature, salinity and vertically-averaged velocity. Earlier missions measured transport to 700 m, later missions (since mid-2013) to 1000 m (Fig. 2). Data from some of the more recent missions is not yet quality-controlled and transport estimates are only preliminary.
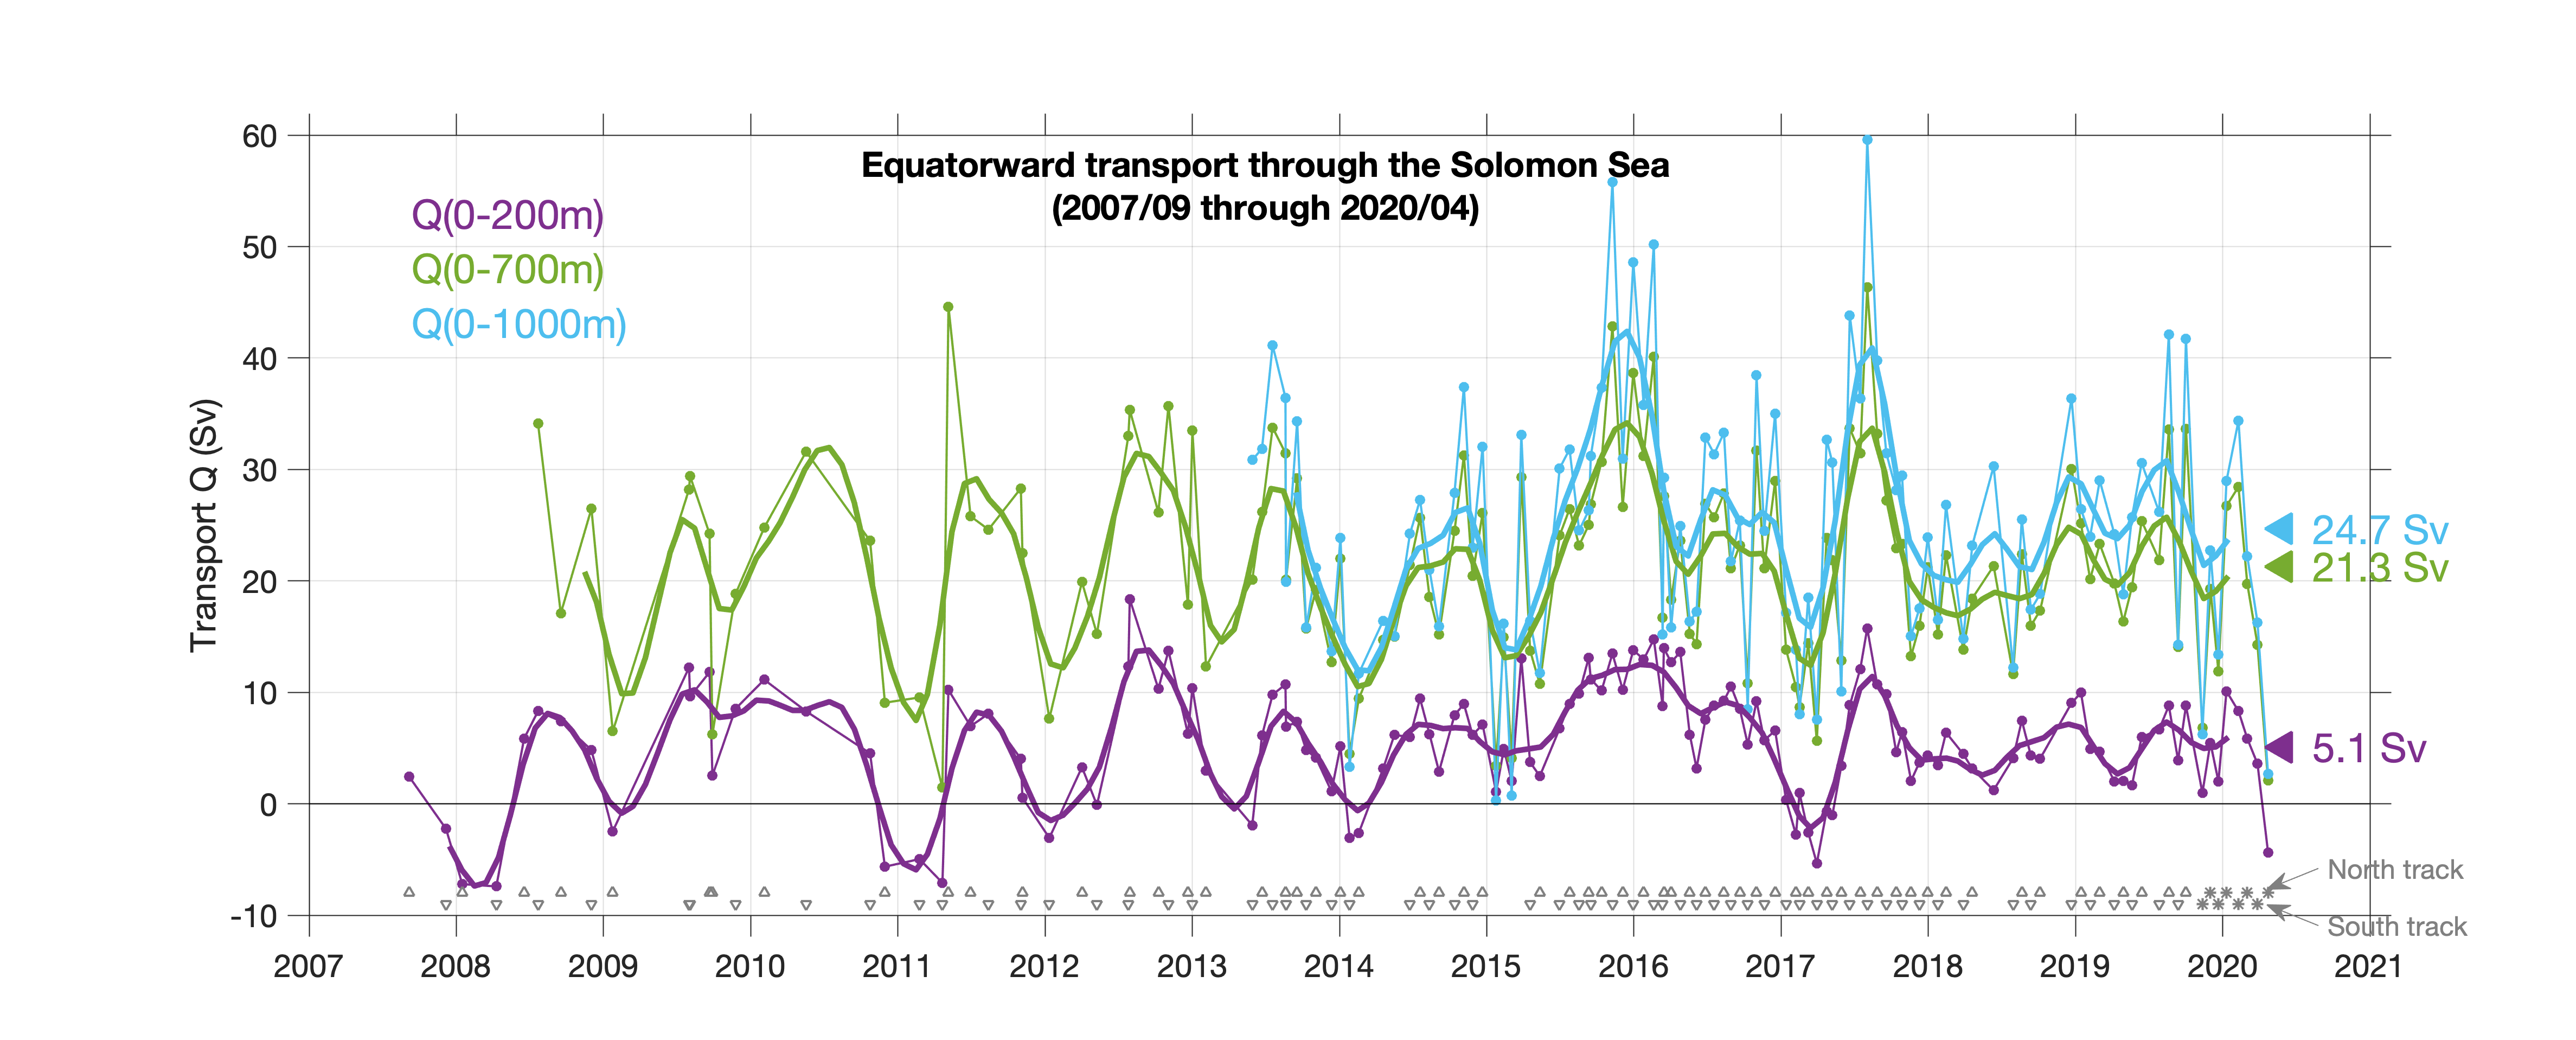
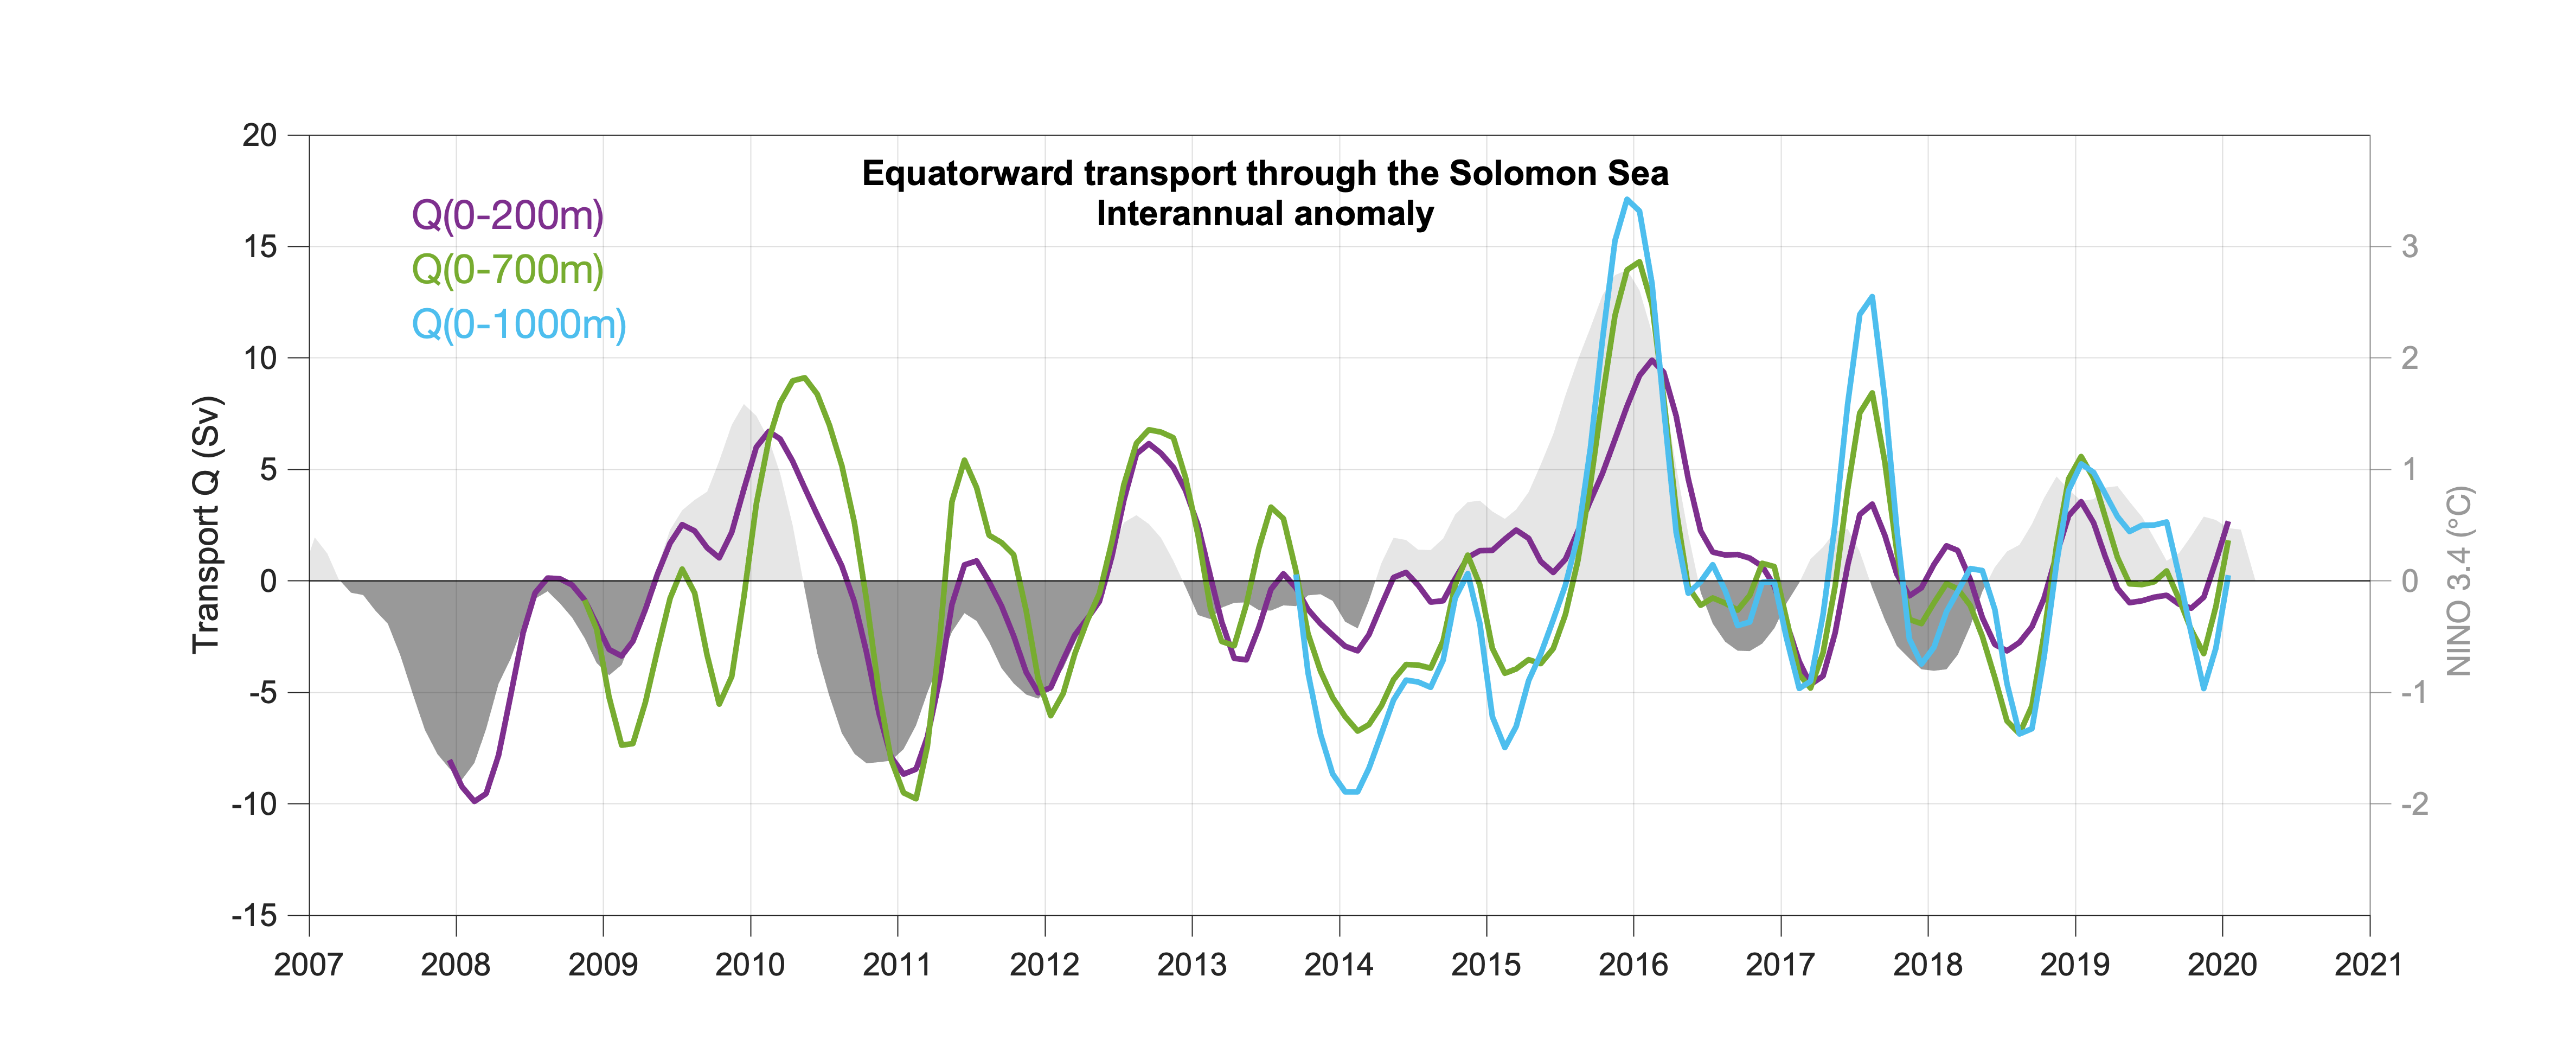
A low-pass monthly time-series represents a smoothed version of the individual section transport time-series capturing its low-frequency variability (Fig.2). The low-pass transport is defined as the sum of the average annual cycle plus the anomalies from this smoothed by a 5-month triangle filter (see Kessler et al. 2019, Section 2.2 for details). Transport through the Solomon Sea varies strongly on ENSO timescales, with large transport occurring during El Niño events (Fig.3). The data files provide both the total and interannual anomaly of the low-pass transport time-series, evaluated monthly.