
CGOA model with no nudging
These results are featured in a manuscript submitted to Progress in Oceanography. Features of This Run
Results
Float TracksWith the results of the regional model, we performed experiments in float tracking. Modeled particles were released on Feb. 15, 1995 and advected by velocities from the regional physical model. Particles were released at 2 depths (green at 10 m and blue at 40 m), and along 3 cross-shelf lines (spheres south of Seward, cubes east of Prince William Sound, and cylinders southeast of Yakutat Bay).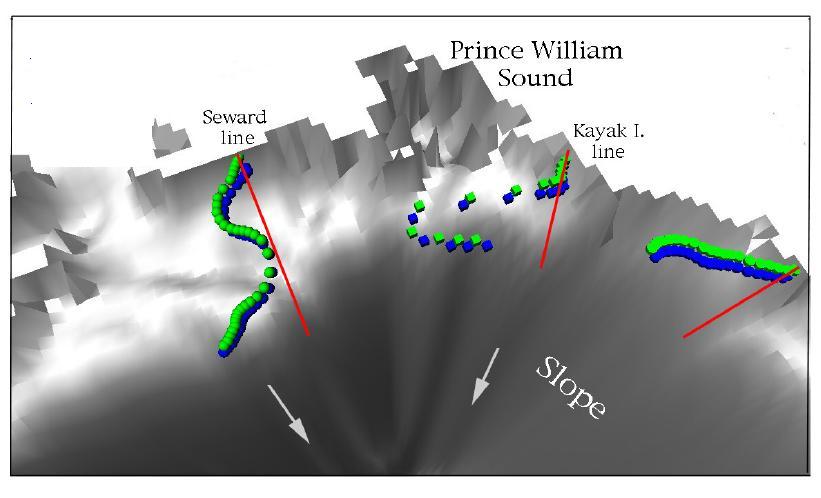 Computed paths indicate pronounced onshore surface flow relative to the trajectories at 40 m depth, which more closely follow isobaths. Floats released near the shore along the Kayak Island line exhibit negligible along-shore advection, while floats released near the shore along the Seward line or near Yakutat experience active advection more typical of the Alaskan Coastal Current. There is a virtual reality demonstration of the trajectories of the modeled particles. In it, bathymetry is rendered as a 3-D grey surface. Some notes on our explorations into low cost stereo virtual reality are available. For those without virtual reality capabilities, there are also some animated gif and QuickTime movies of the results:
General Description of ResultsBoth runs exhibit a prominent Alaska Current - Alaskan Stream system and a weaker Alaskan Coastal Current. In addition to these large scale features, the regional model exhibits an intense, rapidly evolving, 200 km-scale eddy field along the shelf-break, especially during the first week of March, 1995. A similar degree of large eddy activity was observed in the May results for those two years.A general warming is observed in model results from early March through mid-May 1995, though some persistent cold areas remain near the coast. A tongue of warm water penetrates west along the shelf break. A comparison of the simulations for 1995 versus 1997 reveals warmer temperatures in 1997. Refer to the submitted manuscript for elaboration of these results. | ||||||||||||||||||||||


