Event Alarm Status
This page displays the status of automated event-detection alarms for Pre-eruption uplift and Co-eruption subsidence, using the near-real-time data (updated every 15 minutes) from the Bottom Pressure Recorders (NANO-BPRs) on the BOTPT instruments at Axial Seamount, part of the National Science Foundation's (NSF) Ocean Observatories Initiative (OOI) Cabled Array seafloor observatory, operated by the University of Washington. The dates/times in the plots below are in GMT (+8 hrs of local PST, or +7 hrs of PDT time on the US west coast).
LINK BACK TO PAGE WITH MAPS AND OTHER INSTRUMENTS
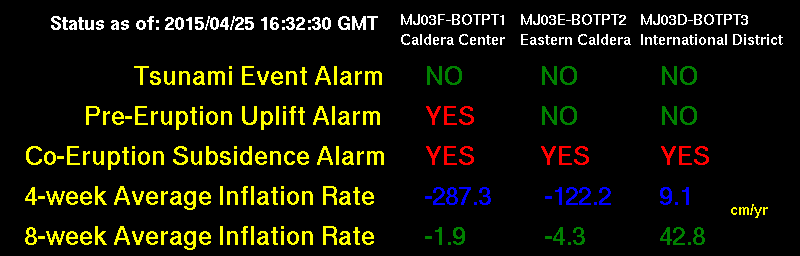
Alarm Status & Long-Term Rate Summary Table
The table below shows the current status of event-detection alarms and long-term uplift rates, updated every 15 minutes. The alarms are for two possible events: (1) pre-eruption rapid uplift (rate of depth change > +10 cm/hr over the last 20 mintues), or (2) co-eruption rapid subsidence (rate of depth change < -10 cm/hr over the last 20 mintues). The table also includes the latest long-term uplift rates calculated from the previous 8- and 12-week time periods, updated daily.
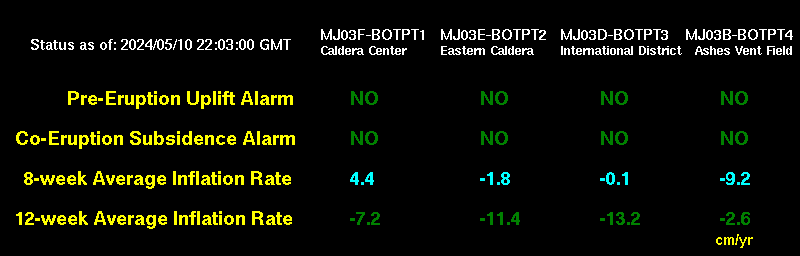
Plot 1: Event alarm and long-term rate summary table, updated every 15 mintues.
Short-Term Rates
The plots below show the short-term rates of depth change that are used for the event-detection alarms in the table above. There is a pair of plots for each of the four BOTPT instruments, showing short-term rates from the last 7 days and over the entire record. The green dots are depth change in cm per 5 minute time intervals (used for a tsunami alarm). The red dots are depth change between an average computed from data 0-10 minutes ago compared to an average 10-20 minutes ago, in cm/hour (used for uplift & subsidence alarms).
BOTPT-A301-MJ03F - Central Caldera
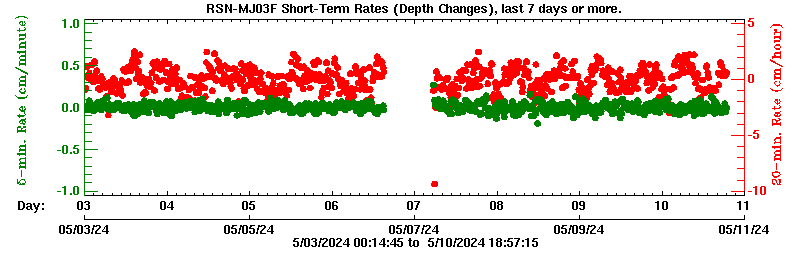
Plot 2: Plot of short-term rates of depth change from the last 5- and 10-20-minutes, over the last 3 days, used for event detection alarms.
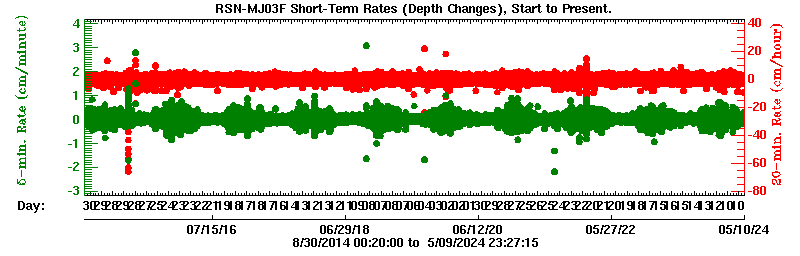
Plot 3: Plot of short-term rates of depth change from the last 5- and 10-20-minutes, over the entire record, used for event detection alarms.
BOTPT-A302-MJ03E - Eastern Caldera
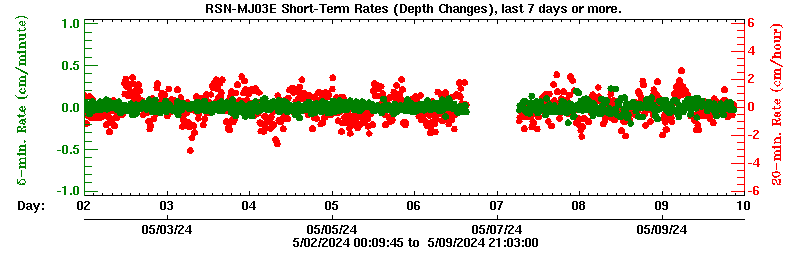
Plot 4: Plot of short-term rates of depth change from the last 5- and 10-20-minutes, over the last 3 days, used for event detection alarms.
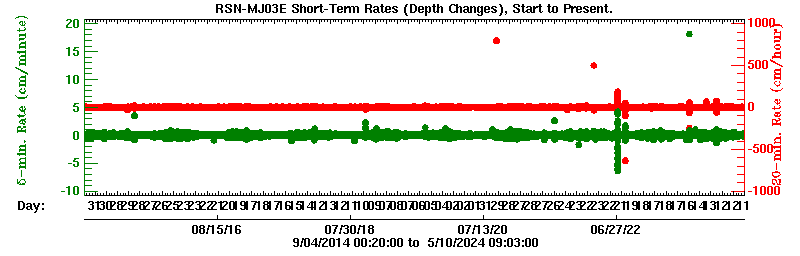
Plot 5: Plot of short-term rates of depth change from the last 5- and 10-20-minutes, over the entire record, used for event detection alarms.
BOTPT-A303-MJ03D - International District
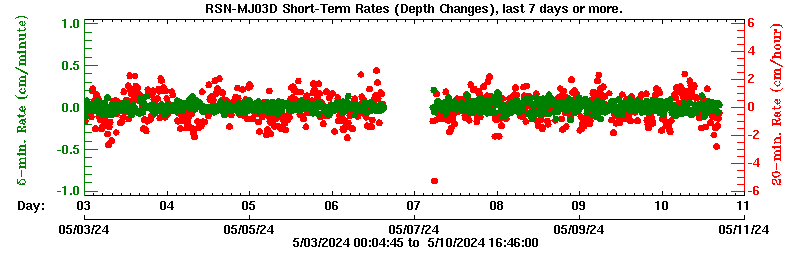
Plot 6: Plot of short-term rates of depth change from the last 5- and 10-20-minutes, over the last 3 days, used for event detection alarms.
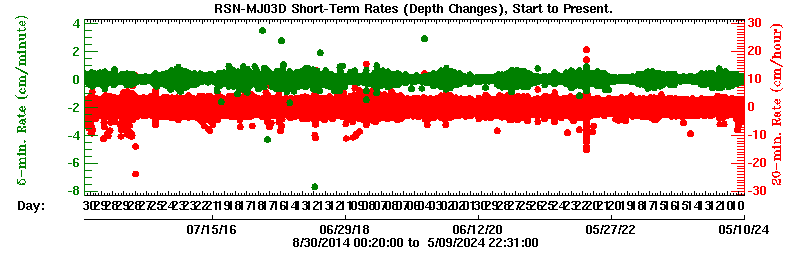
Plot 7: Plot of short-term rates of depth change from the last 5- and 10-20-minutes, over the entire record, used for event detection alarms.
BOTPT-A304-MJ03B - ASHES Vent Field (deployed mid-August 2017)
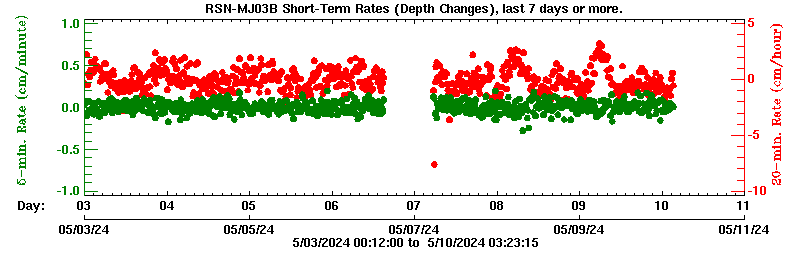
Plot 8: Plot of short-term rates of depth change from the last 5- and 10-20-minutes, over the last 3 days, used for event detection alarms.
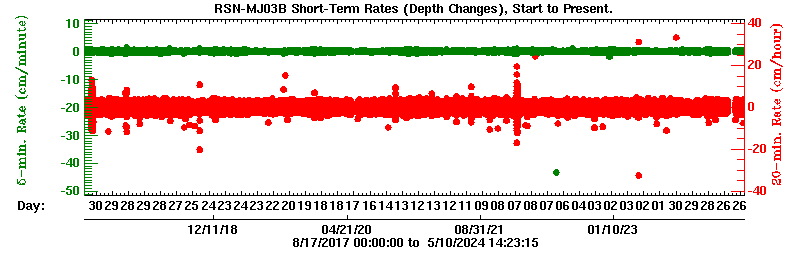
Plot 9: Plot of short-term rates of depth change from the last 5- and 10-20-minutes, over the entire record, used for event detection alarms.
Short-Term Rates during the 24 April 2015 eruption
The plots below show the event alarm status and the short-term rate plots from 25 April 2015, the day after the 24 April eruption started. No plot is shown for the MJ03D - International District BOTPT instrument because it was off-line during the eruption.
Alarm Status & Long-Term Rate Summary Table
Plot 10: Event alarm and long-term rate summary table, from 25 April 2015, the day after the 24 April eruption began.
BOTPT-A301-MJ03F - Central Caldera - 25 April 2015
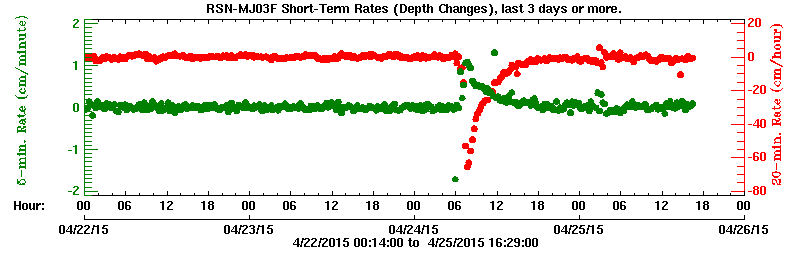
Plot 11: Plot of short-term rates of depth change from the last 5- and 10-20-minutes, over the 3 days before 25 April 2015, used for event detection alarms.
BOTPT-A302-MJ03E - Eastern Caldera - 25 April 2015
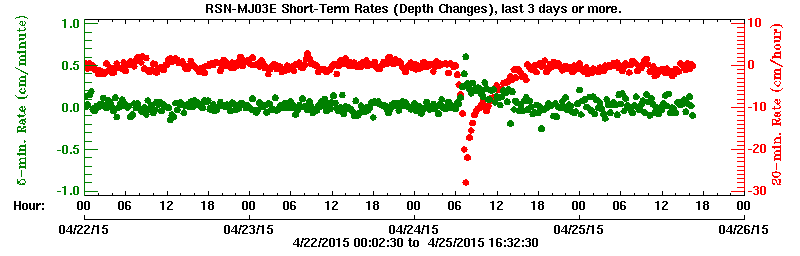
Plot 12: Plot of short-term rates of depth change from the last 5- and 10-20-minutes, over the 3 days before 25 April 2015, used for event detection alarms.
More information
National Science Foundation | The Ocean Observatories Initiative | Cabled Array Observatory
Required OOI disclaimer: This is provided as pre-commissioned data intended for scientific use, and is subject to the OOI Data Policy. This data has not been through Quality Assurance checks.
Required NSF disclaimer: This material is based upon work supported by the National Science Foundation. Any opinions, findings, and conclusions or recommendations expressed in this material are those of the author(s) and do not necessarily reflect the views of the National Science Foundation.