|
| |
||||||||||||||||
R/V Wecoma - CTD Cruise Science
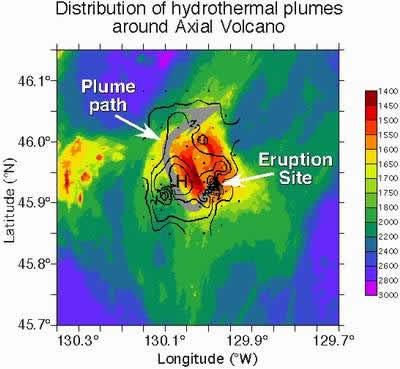
Report - Wednesday, July 25, 2001 Today is our last at Axial Volcano this year, and as we prepare to steam south to our next working area we are thinking about rivers in the deep sea. If that sounds like we are thinking too much about the landscape back home, remember that water in the ocean, at every depth, is always flowing somewhere. There are great ocean rivers that dwarf the Mississippi or the Amazon--the Gulf Stream is familiar to almost everybody--but lesser streams and rivulets are everywhere. One of the interesting questions we have tried to address in studying Axial is the effect that this mountain exerts on the flow of the deep-sea currents that surround it. Besides studying this current-bathymetry interaction for its own sake, we are also interested in mapping the current flow over the summit because it will help us make quantitative estimates of the hydrothermal discharge here. Hydrologists measure the flow and particle concentration in rivers to gauge the mass of silt transported downstream. We are attempting the same technique here, but the size, flow, and even the path of our river is frustratingly difficult to pin down. The figure illustrates some of what we have learned so far. Overlying the color bathymetry of Axial itself are black lines that mark the total distribution of particles in the plumes overlying Axial (these data are from last year, 2000, but the distribution will be little different in 2001). You can see that the densest concentration of contours overlies the eruption site, where the plume is most concentrated. Around the summit the lines are mostly circular, since the plume concentrations decrease with distance from the active venting at the eruption site. If you look carefully, however, you will also see that plume concentrations tend to be higher to the south and west of the summit (the "H" on the map indicates a concentration high to the west of the summit). This distribution, combined with direct measurements of currents we have made here, suggests that there is a circular flow around the summit, here illustrated by the large gray arrow that curls clockwise around the volcano. By improving our understanding of the "Axial river" we will better know how hydrothermal venting here effects not only the volcano summit itself but also the chemistry and life of the surrounding ocean. |
|||||
| NeMO Home |About NeMO | Expeditions | NeMO Net | Explore | Dive! | Education |