|
| |
||||||||||||||||
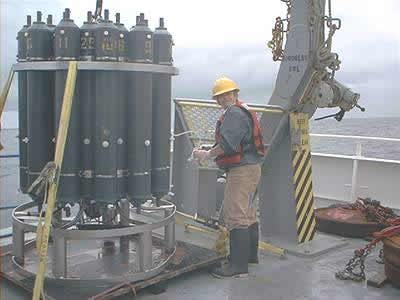
R/V Wecoma - CTD Cruise Science Report - Friday, July 20, 2001 Hydrothermal plumes lurk below us, hidden by a mile of restless sea. How do we gain a vision of those dilute discharges in their dark world? We use two types of operations to map and sample hydrothermal plumes. The simplest one is called a vertical cast. The ship holds position over a location on the seafloor and we lower our instruments slowly down through the water column to within a few meters of the seafloor. The principal instrument package we use is called a "CTD." This acronym stands for "conductivity (an indication of seawater< salinity), temperature, depth," for the primary data that is measured. We also have instruments that measure the turbidity of the water, which estimates the concentration of particulate matter suspended in the plumes. In addition to these instruments the CTD holds 21 special plastic bottles that each capture 20 liter samples of seawater. At the end of the cast, when the CTD is returned to the ship's deck, scientists on board take samples from each bottle to analyze for a variety of chemicals added to the water by hydrothermal venting. The second operation is called a tow-yo and uses the same equipment as a vertical cast. But instead of the ship holding a position, in a tow-yo we are slowly moving through the water at a speed of about 1.5 kts. While the ship is moving we are also raising and lowering the CTD using the winch, so that the path of the CTD above the seafloor traces a sawtooth pattern. This technique allows us to obtain more detailed information about the distribution of hydrothermal plumes over a wide area. Some tows last up to 12 hrs along a trackline almost 20 miles long. Our first few days of sampling shows that venting here is still active, more than 3 and a half years after the volcanic eruption of January 1998. However, even by looking at just a few casts we can see that the intensity continues to decline. This change agrees with our hypothesis that hydrothermal activity is most intense immediately after an eruption, decreases quickly afterwards, and then continues to decline at a slower rate for several years. We'll continue to map the plumes for the next several days. |
|||||
| NeMO Home |About NeMO | Expeditions | NeMO Net | Explore | Dive! | Education |