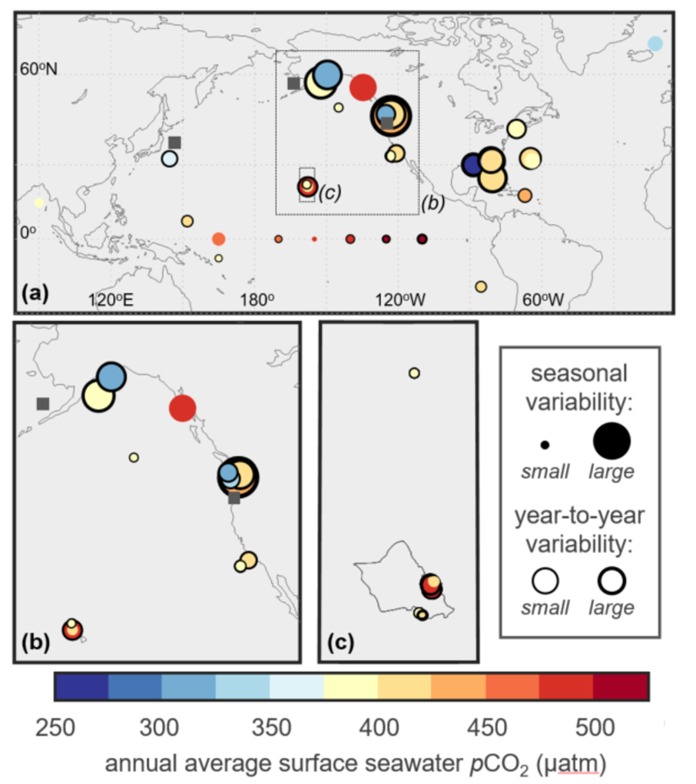
Figure
Location of (a) 40 moored pCO2 time series with insets enlarged for the (b) U.S. West Coast and (c) Hawaiian Island of Oahu. Circle color represents climatological mean seawater pCO2 (µatm), size of circle represents seasonal amplitude, and thickness of circle outline represents interannual variability. From: www.earth-syst-sci-data.net/11/421/2019/.
Credit: Dr. Adrienne Sutton, NOAA PMEL
For commercial use please contact us


