La Niña FAQs
What is La Niña?
La Niña is defined as cooler than normal sea-surface temperatures in the central and eastern tropical Pacific ocean that impact global weather patterns. La Niña conditions recur every few years and can persist for as long as two years.
What is the difference between La Niña and El Niño?
El Niño and La Niña are extreme phases of a naturally occurring climate cycle referred to as El Niño/Southern Oscillation. Both terms refer to large-scale changes in sea-surface temperature across the eastern tropical Pacific. Usually, sea-surface readings off South America's west coast range from the 60s to 70s F, while they exceed 80 degrees F in the "warm pool" located in the central and western Pacific. This warm pool expands to cover the tropics during El Niño, but during La Niña, the easterly trade winds strengthen and cold upwelling along the equator and the West coast of South America intensifies. Sea-surface temperatures along the equator can fall as much as 7 degrees F below normal.
Why do El Niño and La Niña occur?
El Niño and La Niña result from interaction between the surface of the ocean and the atmosphere in the tropical Pacific. Changes in the ocean impact the atmosphere and climate patterns around the globe. In turn, changes in the atmosphere impact the ocean temperatures and currents. The system oscillates between warm (El Niño) to neutral or cold (La Niña) conditions on average every 3-4 years.
What causes La Niña?
Typically, a La Niña is preceded by a buildup of cooler-than-normal subsurface waters in the tropical Pacific. Then, easterly trade winds strengthen, cold upwelling off the west coast of South America and along the equator intensifies, and sea-surface temperatures (SSTs) drop below normal. During the 1988- 89 La Niña, SSTs fell to as much as 4 degrees C (7 degrees F) below normal. Both La Niña and El Niño tend to peak during the Northern Hemisphere winter.
What's the difference between La Niña and El Niño?
Both terms refer to large-scale changes in sea-surface temperature across the central and eastern tropical Pacific. Usually, sea-surface readings off South America's west coast range from the 60s to 70s F, while they exceed 80 degrees F in the "warm pool" located in the central and western Pacific. This warm pool expands to cover the tropics during El Niño but shrinks to the west during La Niña. The El Niño/Southern Oscillation (ENSO) is the coupled ocean-atmosphere process that includes both El Niño and La Niña.
What are the global impacts of La Niña?
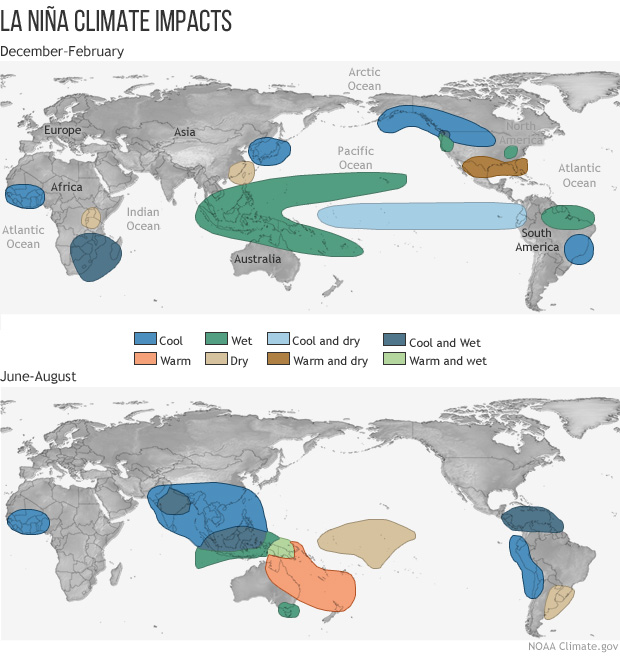
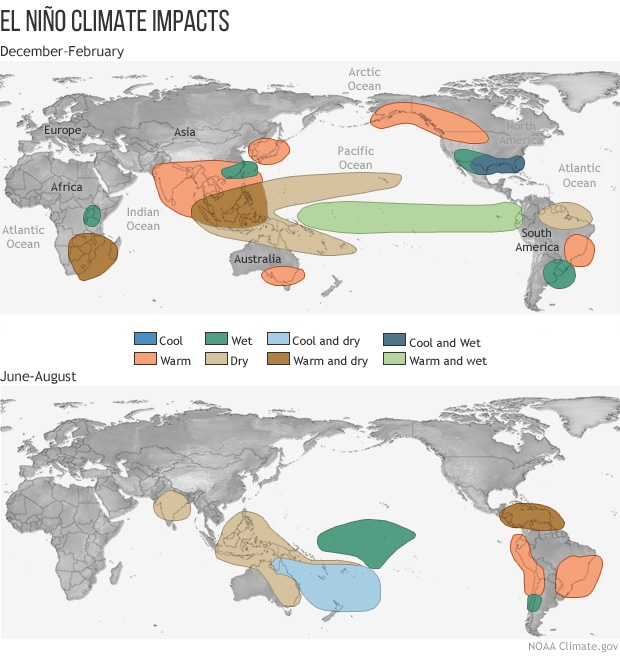
Both El Niño and La Niña impact global and U.S. climate patterns. In many locations, especially in the tropics, La Niña (or cold episodes) produces roughly the opposite climate variations from El Niño. For instance, parts of Australia and Indonesia are prone to drought during El Niño, but are typically wetter than normal during La Niña. Climate impacts of La Niña and El Niño are shown below for December-February (top panels) and June - August (bottom panels). Click for larger images.
What are the U.S. impacts of La Niña?
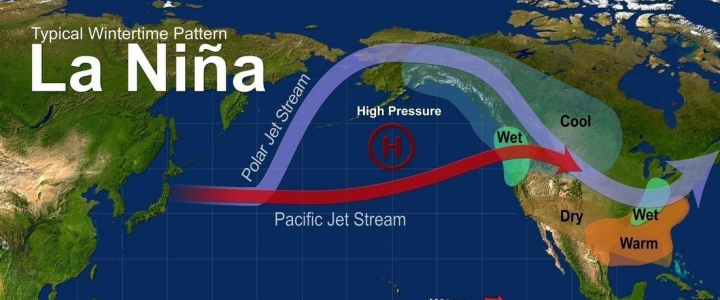
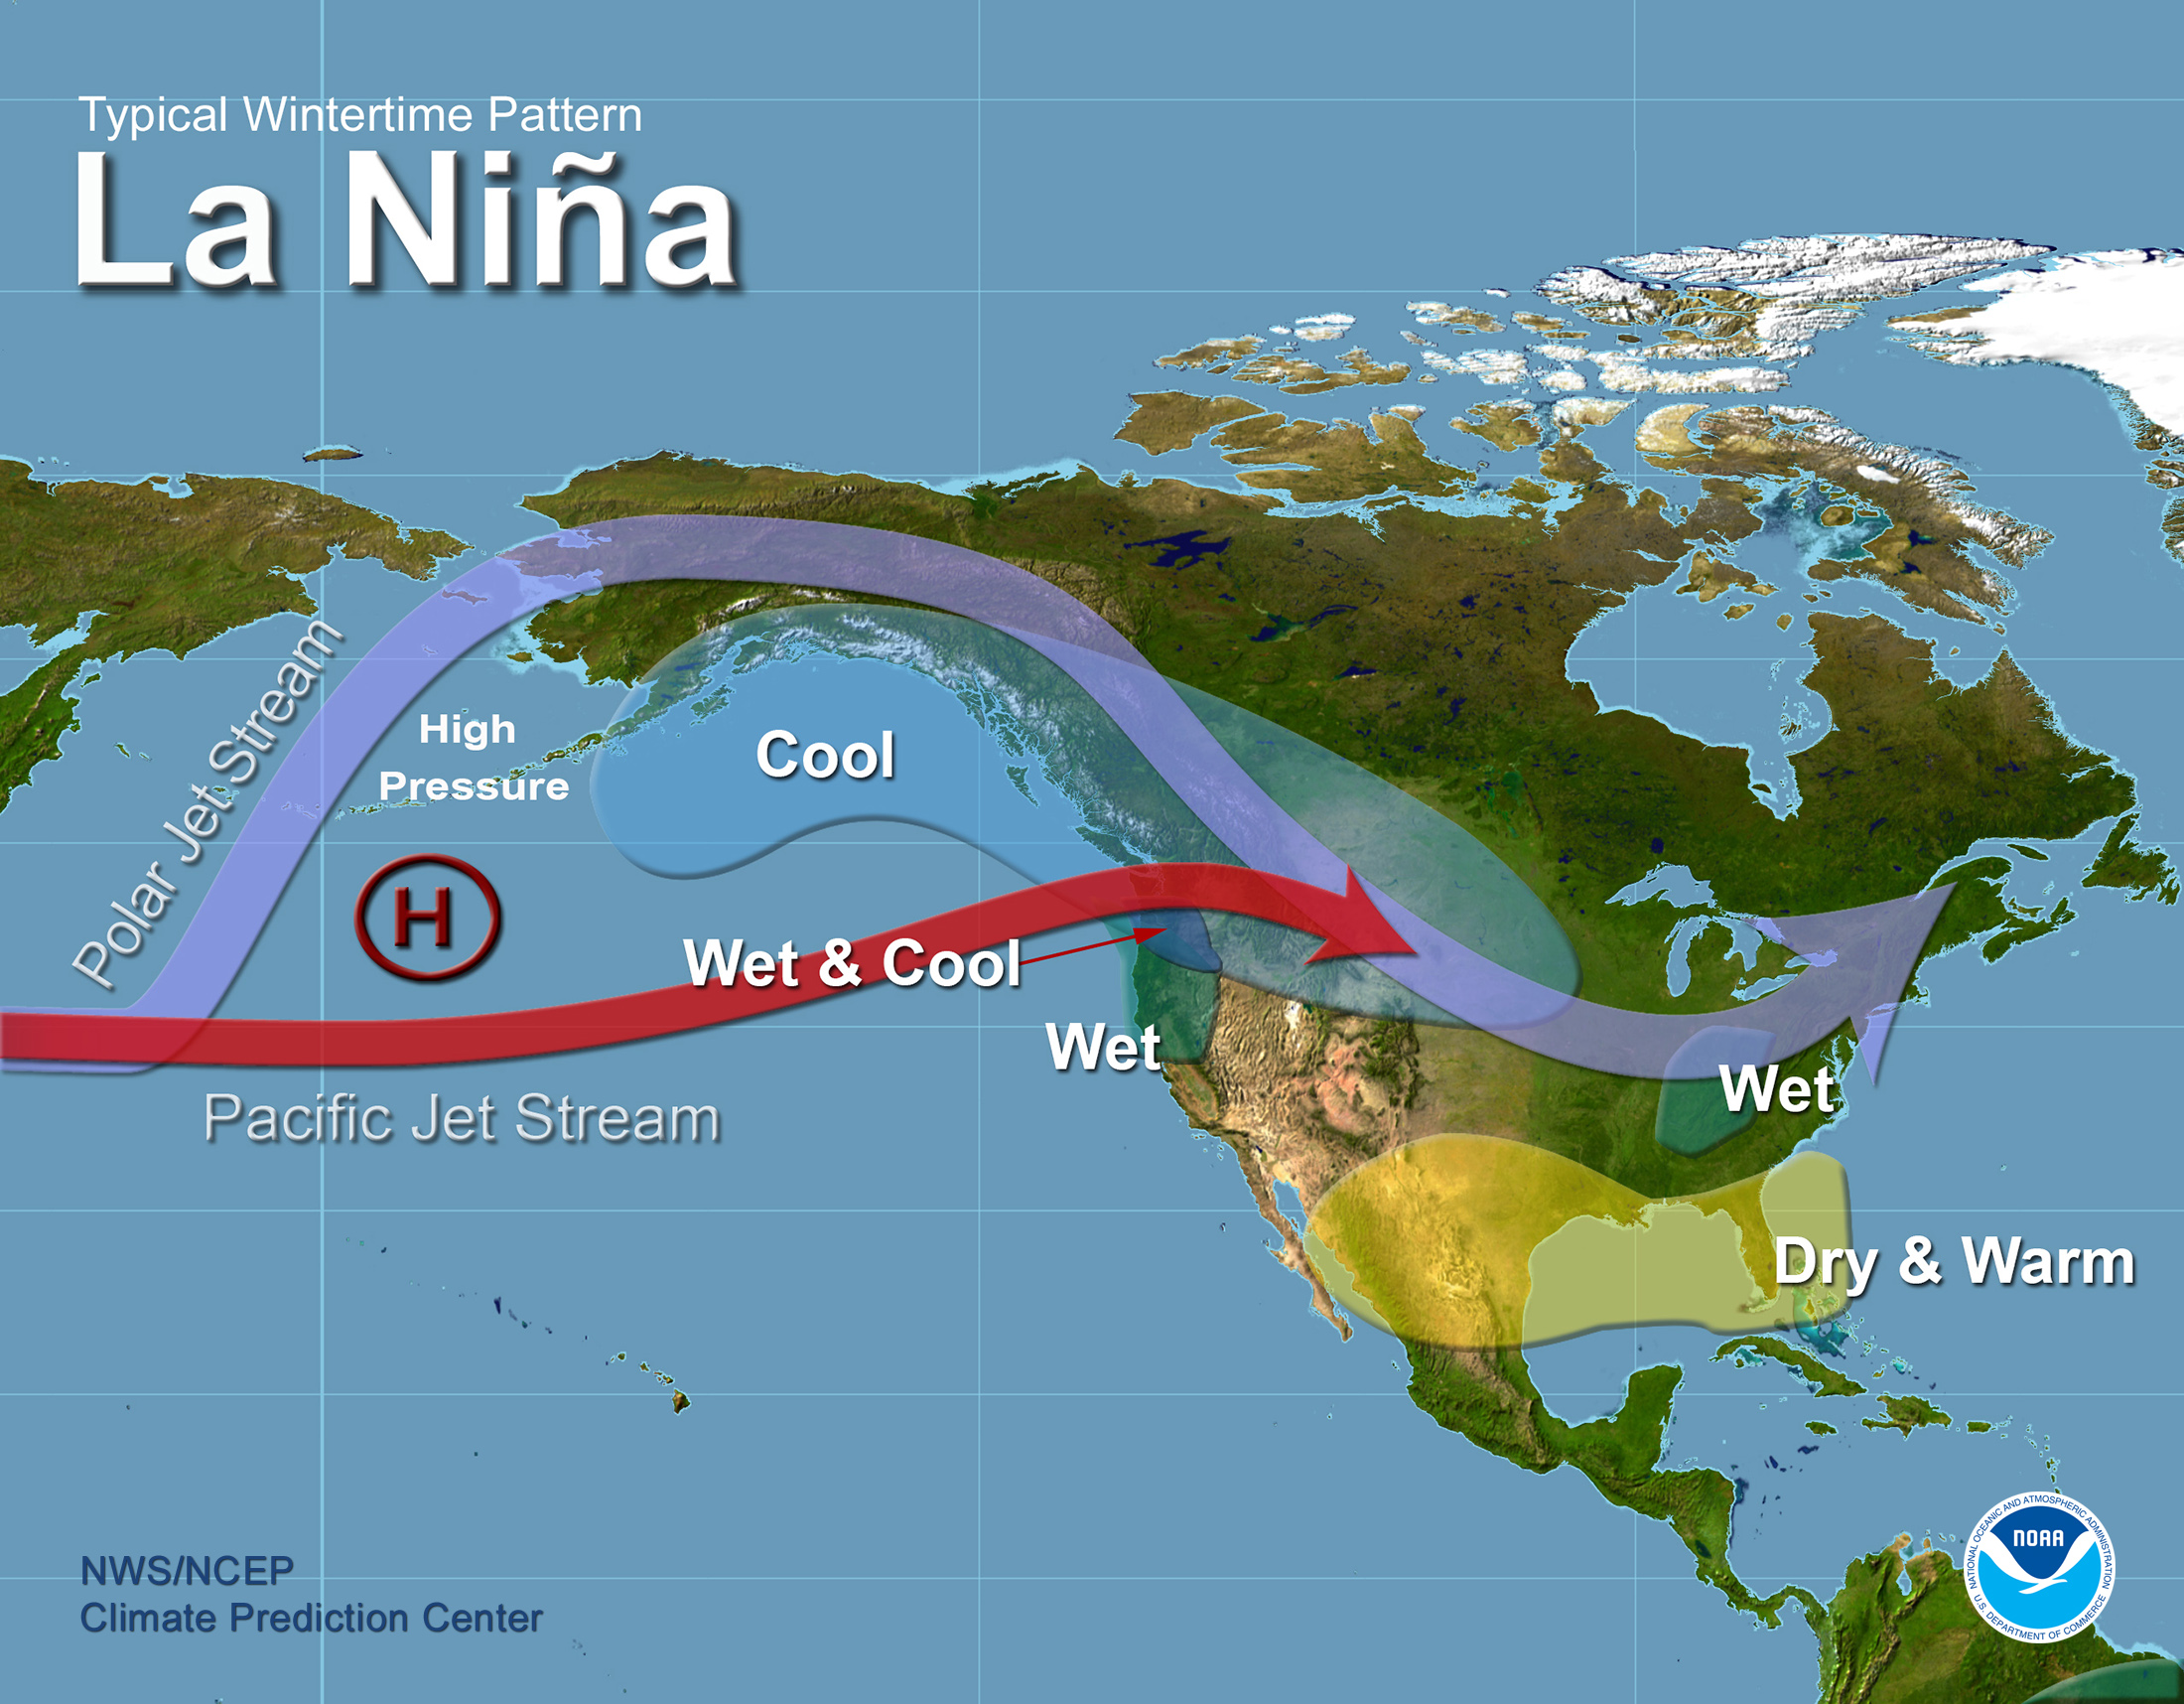
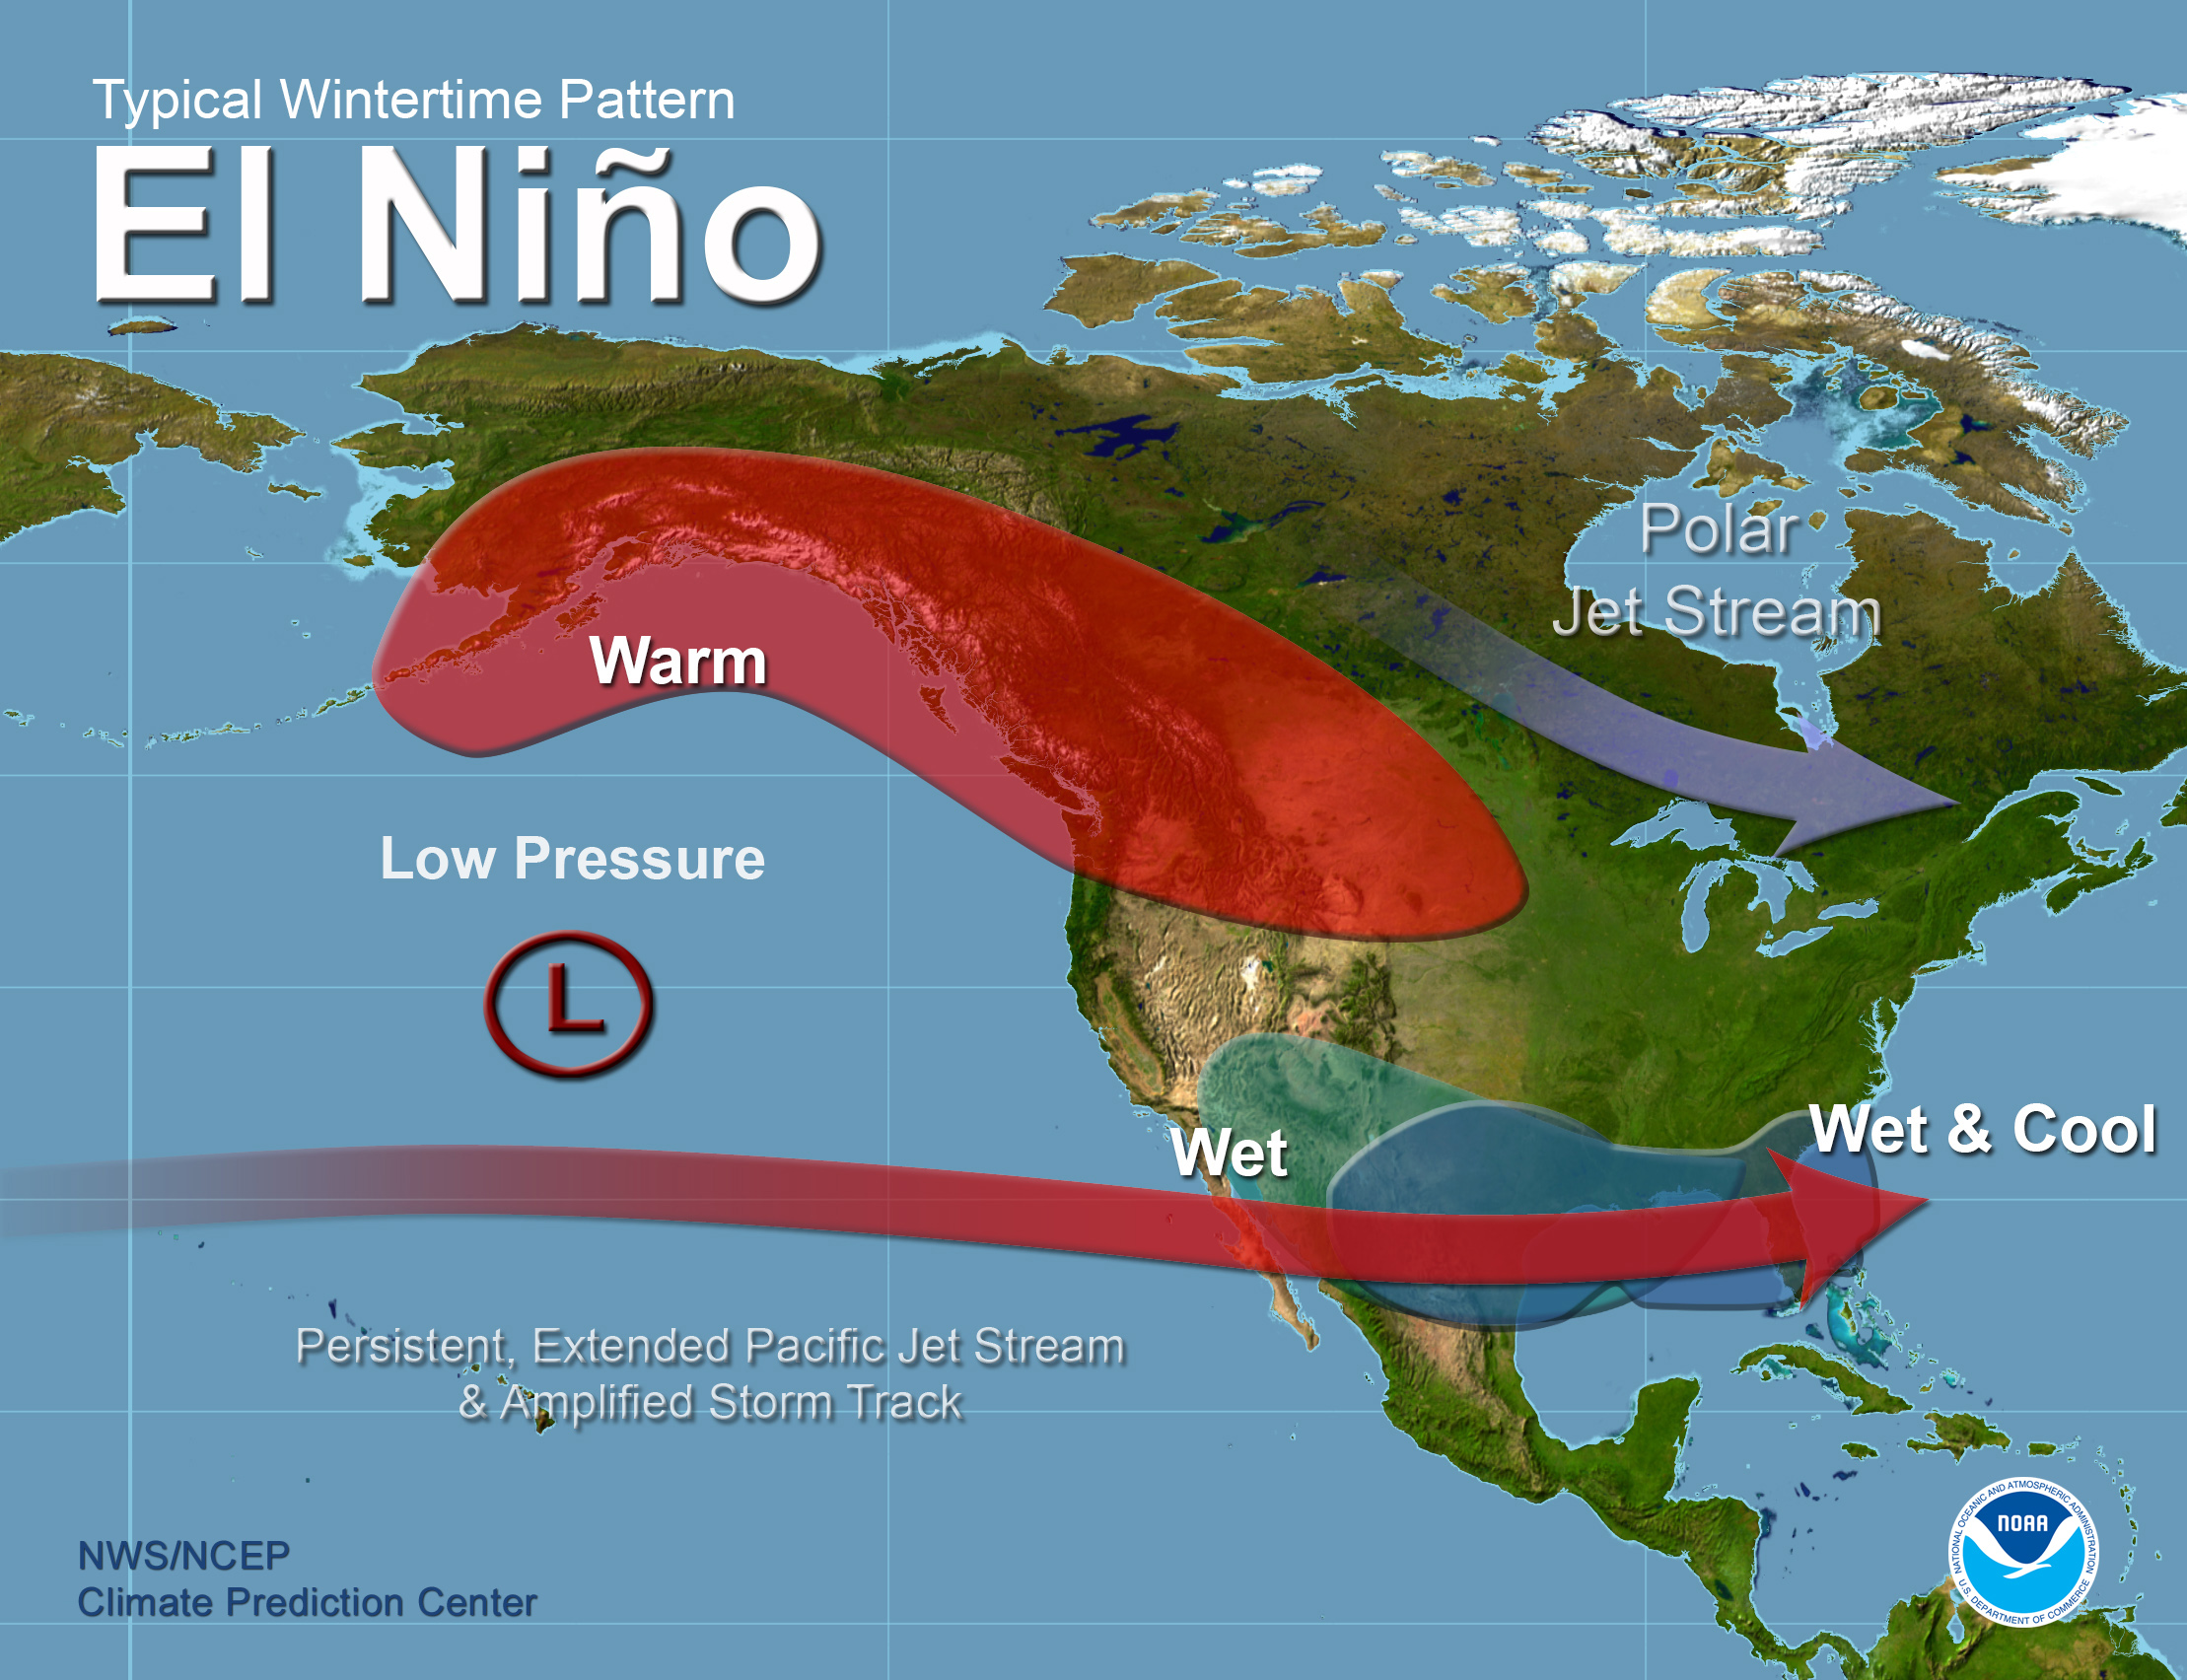
La Niña often features drier than normal conditions in the Southwest in late fall through the subsequent winter. Drier than normal conditions also typically occur in the Central Plains in the fall and in the Southeast in the winter. In contrast, the Pacific Northwest is more likely to be wetter than normal in the late fall and early winter with the presence of a well-established La Niña. Additionally, on average La Niña winters are warmer than normal in the Southeast and colder than normal in the Northwest. Typical wintertime patterns are shown below for El Niño and La Niña (click for larger images).
Does a La Niña always follow an El Niño?
No, a La Niña episode may, but does not always follow an El Niño.
Is there such a thing as "normal", aside from El Niño and La Niña?
Over the long-term record, sea-surface temperatures in the central and eastern tropical Pacific diverge from normal in a roughly bell-curve fashion, with El Niño and La Niña at the tails of the curve. Some researchers argue there are only two states, El Niño and non-El Niño, while others believe either El Niño or La Niña is always present to a greater or lesser degree. According to one expert, NCAR's Kevin Trenberth, El Niños were present 31% of the time and La Niñas 23% of the time from 1950 to 1997, leaving about 46% of the period in a neutral state.
How often does La Niña occur?
El Niño and La Niña occur on average every 3 to 5 years. However, in the historical record the interval between events has varied from 2 to 7 years. According to the National Centers for Environmental Prediction, this century's previous La Niñas began in 1903, 1906, 1909, 1916, 1924, 1928, 1938, 1950, 1954, 1964, 1970, 1973, 1975, 1988, 1995,1998, 2007, 2010. These events typically continued into the following spring.
How long does a La Niña last?
La Niña conditions typically last approximately 9-12 months. Some episodes may persist for as long as two years.
How do scientists detect La Niña and El Niño and predict their evolution?
Scientists from NOAA and other agencies use a variety of tools and techniques to monitor and forecast changes in the Pacific Ocean and the impact of those changes on global weather patterns. In the tropical Pacific Ocean, El Niño is detected by many methods, including satellites, moored buoys, drifting buoys, sea level analysis, and expendable buoys. Many of these ocean observing systems were part of the Tropical Ocean Global Atmosphere (TOGA) program, which has now become an operational El Niño/Southern Oscillation (ENSO) observing system.
Large computer models of the global ocean and atmosphere, such as those at the National Centers for Environmental Prediction, use data from the ENSO observing system as input to predict El Niño. Other models are used for El Niño research, such as those at NOAA's Geophysical Fluid Dynamics Laboratory, at the Center for Ocean-Land-Atmosphere Studies, and other research institutions.
Why is predicting these types of events so important?
Better predictions of the potential for extreme climate episodes like floods and droughts could save the United States billions of dollars in damage costs. Predicting the onset of a warm or cold phase is critical in helping water, energy and transportation managers, and farmers plan for, avoid or mitigate potential losses. Advances in improved climate predictions will also result in significantly enhanced economic opportunities, particularly for the national agriculture, fishing, forestry and energy sectors, as well as social benefits.
What is the relationship between El Niño/La Niña and global warming?
The jury is still out on this. Are we likely to see more El Niños because of global warming? Will they be more intense? These are the main research questions facing the science community today. Research will help us separate the natural climate variability from any trends due to man's activities. We cannot figure out the "fingerprint" of global warming if we cannot sort out what the natural variability does. We also need to look at the link between decadal changes in natural variability and global warming.
Is this a "La Niña" hurricane/tropical storm/drought/fire/flood/winter storm?
It is inaccurate to label individual storms or events as a La Niña or El Niño event. Rather, these climate extremes affect the position and intensity of the jet streams, which in turn affect the intensity and track of storms.
How is La Niña influencing the Atlantic and Pacific hurricane seasons?
Dr. William Gray at the Colorado State University pioneered research efforts leading to the discovery of La Niña impacts on Atlantic hurricane activity, and to the first operational long-range forecasts of Atlantic basin hurricane activity. According to this research, the chances for the continental U.S. and the Caribbean Islands to experience hurricane activity increases substantially during La Niña.
In May 2014, Dr. Gerry Bell explained the impacts of El Niño and La Niña on the hurricane season in the Atlantic and the Pacific. This visualization for June 1-Nov 30, 2010 from the NOAA Environmental Visualization laboratory illustrates the extremely active Atlantic Hurricane Season that occurred during the 2010 La Niña. For more information, see Hurricane information from the National Weather Service.
What impacts do El Niño and La Niña have on tornadic activity across the country?
Since a strong jet stream is an important ingredient for severe weather, the position of the jet stream determines the regions more likely to experience tornadoes.
Contrasting El Niño and La Niña winters, the jet stream over the United States is considerably different. During El Niño the jet stream is oriented from west to east over the northern Gulf of Mexico and northern Florida. Thus this region is most susceptible to severe weather. During La Niña the jet stream extends from the central Rockies east- northeastward to the eastern Great Lakes. Thus severe weather is likely to be further north and west during La Niña than El Niño. For more information, see Tornado information and the Storm Prediction Center from the National Weather Service.
How are sea surface temperatures monitored?
Sea surface temperatures in the tropical Pacific Ocean are monitored with data buoys and satellites. NOAA and its international partners operate a network of 70 data buoys along the equatorial Pacific that provide important data about conditions at the ocean's surface. The data is complimented with satellite data collected by NOAA's Polar Orbiting Environmental Satellites and other satellites.
How are the data buoys used to monitor ocean temperatures?
Observations of conditions in the tropical Pacific are essential for the prediction of short term (a few months to one year) climate variations. To provide necessary data, NOAA operates a network of buoys that measure temperature, currents and winds in the equatorial band. These buoys transmit data that are available to researchers and forecasters around the world in real time.
Initial text for this page courtesy of NOAA Public Affairs.


