| |
| |
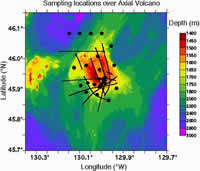
This figure shows the planned pattern of vertical
CTD casts (solid dots) and tow-yos (dark lines) over the summit of
Axial
Volcano. The bathymetry of Axial Volcano is shown in color, and the
depths are in meters below the sea surface. Axial rises some 1400
m
above the surrounding seafloor.
|
|
R/V Wecoma - CTD Cruise
Science News
Science Report - Saturday, July 21, 2001
Chief Scientist Ed Baker
Imagine
flying over Mt. Rainer National Park at night, trying to locate camp sites
by detecting the wispy smoke drifting downwind from campfires. We're floating
not flying, and looking for vent sites not camp sites, but we have a similar
challenge out here. One difference, of course, is that we already know
where most of the vent sites are located thanks to the extensive seafloor
mapping conducted by the ROPOS team over the last few years. Our efforts
are directed at trying to estimate how much hydrothermal fluid is leaking
out of the crust throughout the caldera of Axial Volcano. The seafloor
observations can precisely measure the volume and composition of fluids
exiting from a few vent sites, but the caldera floor is highly porous
and fluid can leak out of the crust in countless places. As these warm
fluids rise into the water column they coalesce into a single plume, much
as thousands of cars on many highways contribute to a single layer of
smog over a city. By mapping the distribution and intensity of the plumes
formed by hydrothermal fluids, we can estimate the total supply of those
fluids from the seafloor.
In
order to map the plumes we must crisscross the summit of the volcano like
a spider weaving a web. We try to collect data in a grid-like pattern.
We can then put the data into a plotting program and make maps of the
distribution of temperature, or particles, or dissolved metals, or other
hydrothermal chemical, just as geographers make maps of mountains and
valleys by plotting the elevation of the earth's surface (or the ocean's
bottom!). Today we are about half way through our data collection here,
with three more days till we depart for another part of the Juan de Fuca
Ridge. We'll post a map of the plumes we find here after we're done.
|
|

