[Thread Prev][Thread Next][Index]
[ferret_users] listing with projected data
- To: ferret_users@xxxxxxxx
- Subject: [ferret_users] listing with projected data
- From: jagadish karmacharya <j_karmacharya@xxxxxxxxx>
- Date: Mon, 10 Apr 2006 03:05:24 -0700 (PDT)
- Domainkey-signature: a=rsa-sha1; q=dns; c=nofws; s=s1024; d=yahoo.com;h=Message-ID:Received:Date:From:Subject:To:MIME-Version:Content-Type:Content-Transfer-Encoding;b=kOcZxCIuRXUfzidsPsoTJk8jmjJyIRAjfH76QKVB/48f+X5YnI/TjN8f7jNPKVMJmbWTx3YlTb28/dwBg2WfR0bftRyyjq2tihwFRjwgZanxAjWiq0dXID/Fm6sfCwtpPPayFrXfu3NGuBqV8cqyewTCcg4ctnPfgwIEd/IqQ+g= ;
- Sender: owner-ferret_users@xxxxxxxxxxxxx
Dear ferreters,
I have model output in rotated mercator projection.I can plot the figure and correctly overlay the boundaries using map projection information.But I have difficulty listing the data at a specific location.
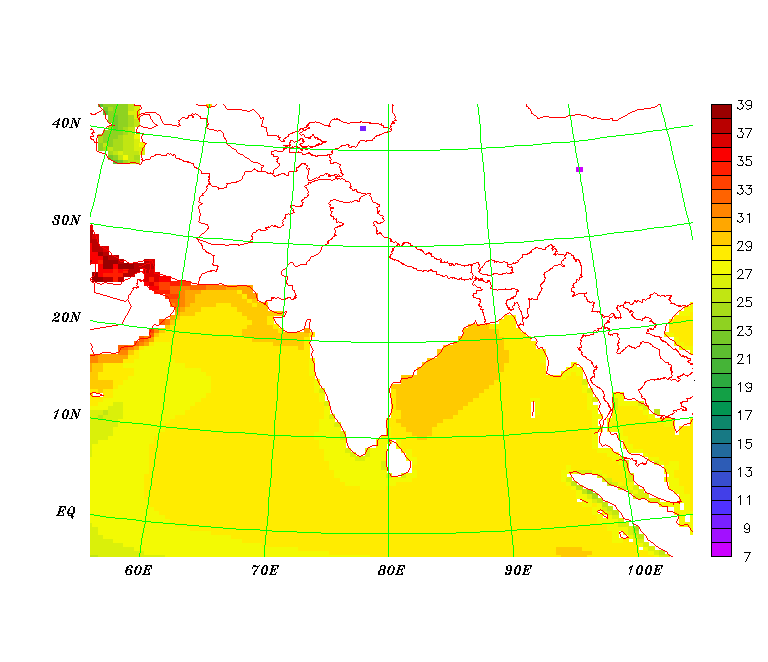
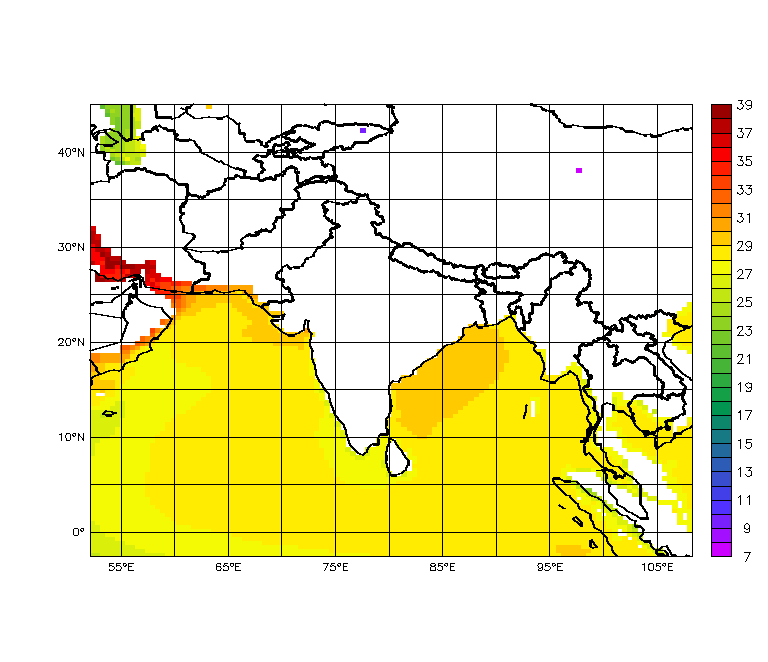
To elaborate my problem I have attached two figures with land mask. Data is correctly plotted in fig 1 using map projection information(ie shade ta[l=6,d=1]*ocnmsk -273, x_page,y_page); but figure 2 is plotted without map projection information (ie shade ta[l=6,d=1]*ocnmsk-273).
To illustrate, let consider a inland water body (in pink color) over Tibet lying at 100 parallel (in
figure 1). Unprojected map (figure 2) shows same spot at about 97.5E.
List command shows (ocnmsk is for masking land points)
list/x=96:102/y=35:40 ta[l=6,d=1]*ocnmsk-273
VARIABLE : TA[L=6,D=SRF2000AVG]*OCNMSK-273
SUBSET : 14 by 13 points (LONGITUDE-LATITUDE)
TIME : 01-DEC-2000 00:00
95.82E 96.3E 96.77E 97.25E 97.72E 98.2E 98.67E 99.15E 99.62E 100.09E100.57E101.04E101.51E101.99E
92 93 94 95 96 97 98 99 100 101 102 103 104 105
40.19N / 98: .... .... .... .... .... .... .... .... .... .... .... .... .... ....
39.76N / 97: .... .... .... .... .... .... .... ....
.... .... .... .... .... ....
39.34N / 96: .... .... .... .... .... .... .... .... .... .... .... .... .... ....
38.91N / 95: .... .... .... .... .... .... .... .... .... .... .... .... .... ....
38.48N / 94: .... .... ....
.... .... .... .... .... .... .... .... .... .... ....
38.05N / 93: .... .... .... .... 7.593 .... .... .... .... .... .... .... .... ....
37.62N / 92: .... .... .... .... .... .... .... .... .... .... .... .... .... ....
37.19N / 91: .... .... .... .... .... .... .... .... .... .... .... .... .... ....
36.76N / 90: .... .... .... .... .... .... .... .... .... .... .... .... .... ....
36.33N / 89: .... .... .... .... .... .... .... .... .... ....
.... .... .... ....
35.89N / 88: .... .... .... .... .... .... .... .... .... .... .... .... .... ....
35.46N / 87: .... .... .... .... .... .... .... .... .... .... .... .... .... ....
35.02N / 86: .... .... .... .... ....
.... .... .... .... .... .... .... .... ....
ie it list the coordinate of the grid as 97.72E, 38.05N (in agreement with its position with respect to unprojected map) but its actual position is along 100E ( as plotted in project map )
This implies that if I specify the true lat/long position of say a city in list command then the listed value displayed for projected data is not for that location but for another location
shifted by some distance.This shift will consequently affect the Arial average over a region as well!
!for example in above case
!list/x=100/y=38.3 ta[l=6,d=1]*ocnmsk-273
! VARIABLE : TA[L=6,D=SRF2000AVG]*OCNMSK-273
LONGITUDE:
100.1E(100.1)
LATITUDE : 38.5N
TIME : 01-DEC-2000 00:00
....
Now My question is: how to list data from map projected model output such that it corresponds to
true lat/long position (as displayed in projected map) (ie is there equivalent qualifier for list command like x_page,y_page for contour in plotting projected map?)
May be I need to use function CURV_TO_RECT but I couldn't correctly grasp the idea from the appendix/mail archieves.
Thanking in advance!
Jagadish
=========================
My data="">
sh d
currently SET data sets:
1> ../SRF2000AVG.nc
name
title I J K L
UA Anemom Zonal Winds 1:118 1:109 ... 1:12
VA Anemom Merid Winds 1:118 1:109 ... 1:12
TA Anemom Temp 1:118 1:109
... 1:12
QA Anemom Spec Humidity 1:118 1:109 ... 1:12
sh grid ta
GRID GLM1
name axis # pts start end
LON LONGITUDE 118mi 52.372E(52.373) 108.09E(108.09)
LAT LATITUDE 109 i 2.378S 44.79N
normal Z
TIME TIME 12 i 15-JAN-2000 00:00
15-DEC-2000 00:00
Blab-away for as little as 1¢/min. Make PC-to-Phone Calls using Yahoo! Messenger with Voice.

[Thread Prev][Thread Next][Index]
Dept of Commerce /
NOAA /
OAR /
PMEL /
TMAP
Contact Us | Privacy Policy | Disclaimer | Accessibility Statement
