Spectrograms |
||||||||||
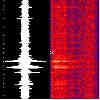
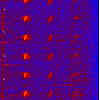
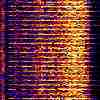
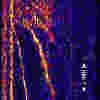
A convenient means for studying sound is to display recorded signals as "spectrograms" of time versus frequency. In the examples shown here, time increases up the page and frequency increases to the right. Using spectrograms, a trained analyst can determine the nature of the received sound (in most cases). Links to each type and view-all |
||||||||||