

What's New

Feature Publication
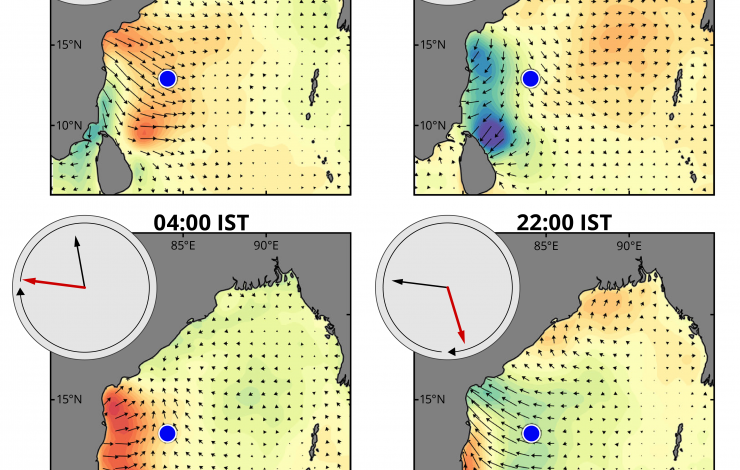
Land breeze wind vectors in the Bay of Bengal at four times of day (India Standard Time) for the average of July and August during the Southwest Monsoon. Red shading indicates winds that are stronger than the daily average and blue shading indicates winds that are weaker than the daily average. Inset shows surface currents (in red) and surface wind stress (in black) relative to the daily average at the location of the instrumented buoy (blue dot) for each of the four times.
Ekman's theory of wind-driven ocean currents on a rotating planet is central to our understanding of why surface currents are deflected to the right of the winds in the Northern Hemisphere and to the left of the winds in the Southern Hemisphere. The theory admits solutions for currents deflected in the opposite direction at periods shorter than the local inertial period, but Ekman did not mention these currents and they have only rarely been observed. This paper describes a prominent example... more