U.S. Dept. of Commerce / NOAA/ OAR / PMEL / Publications
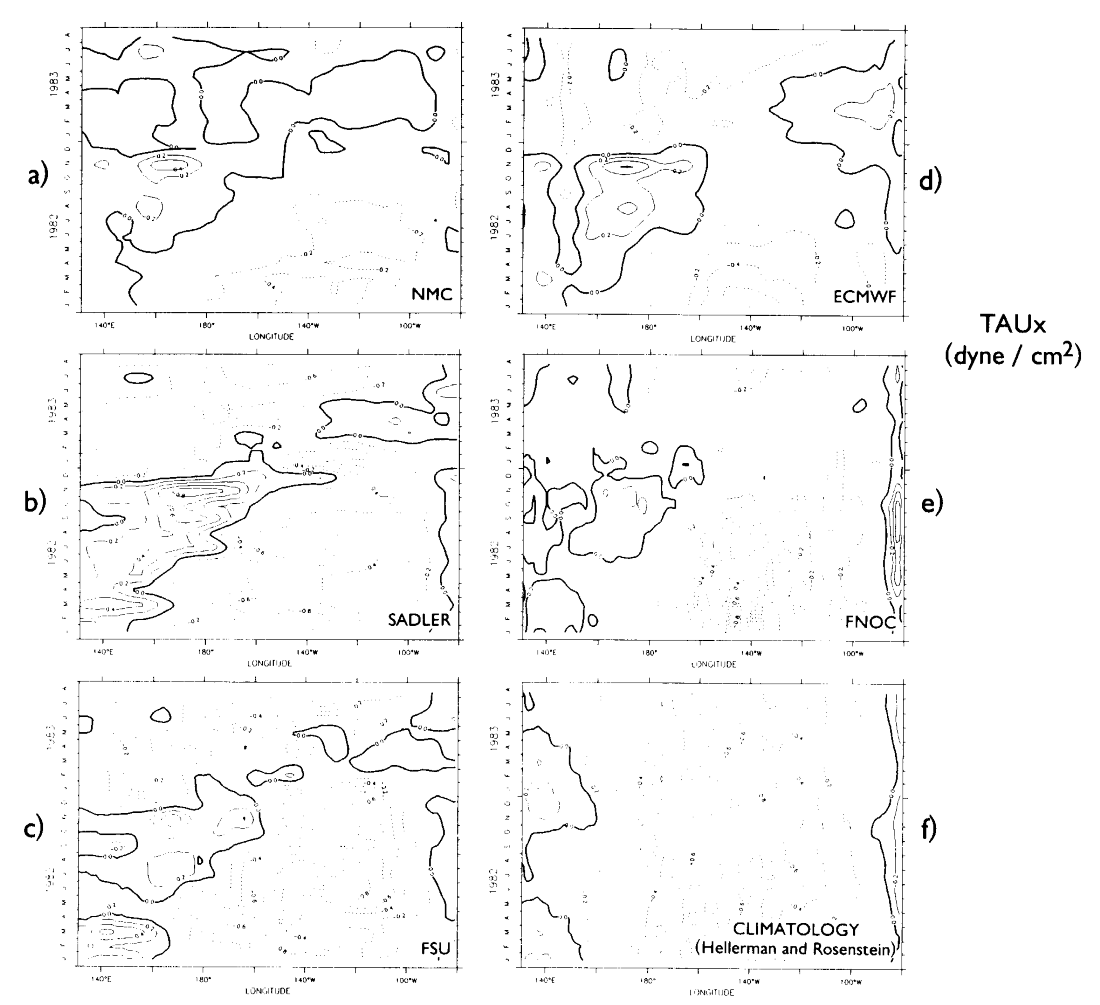
In order to understand the hindcast SST changes and change mechanisms, it is useful to have some information about the forcing fields that were used in the different hindcasts. The five basic hindcast experiments make use of five different monthly men wind pseudostress or stress analyses [obtained from the U.S. Navy's Fleet Numerical Ocean Center (FNOC), from the European Centre for Medium Range Forecasting (ECMWF), from the National Meteorological Center (NMC), from the special ship wind analysis effort at Florida State University (FSU) and from the special ship wind/adjusted cloud motion vector analyses of Sadler at U. Hawaii (SADLER)]. Harrison et al. (1988) describe how the various wind stress fields which were used in the hindcasts were produced from the operational and research products. Figures 2 and 3 present the zonal and meridional components of wind stress within 2 degrees of the equator, as they were interpolated in time and used to drive the ocean model. In addition the Hellerman and Rosenstein (1983) climatological stresses, which were used in the model spinup, are plotted for reference.
Figure 2. Monthly average zonal wind stress fields, averaged between 2°N and 2°S, for the different wind stress analyses used in the model hindcast experiments: ECMWF, FNOC, FSU, NMC and SADLER. See text for notation and discussion. The Hellerman and Rosenstein (1983) climatological stress is presented for comparison.
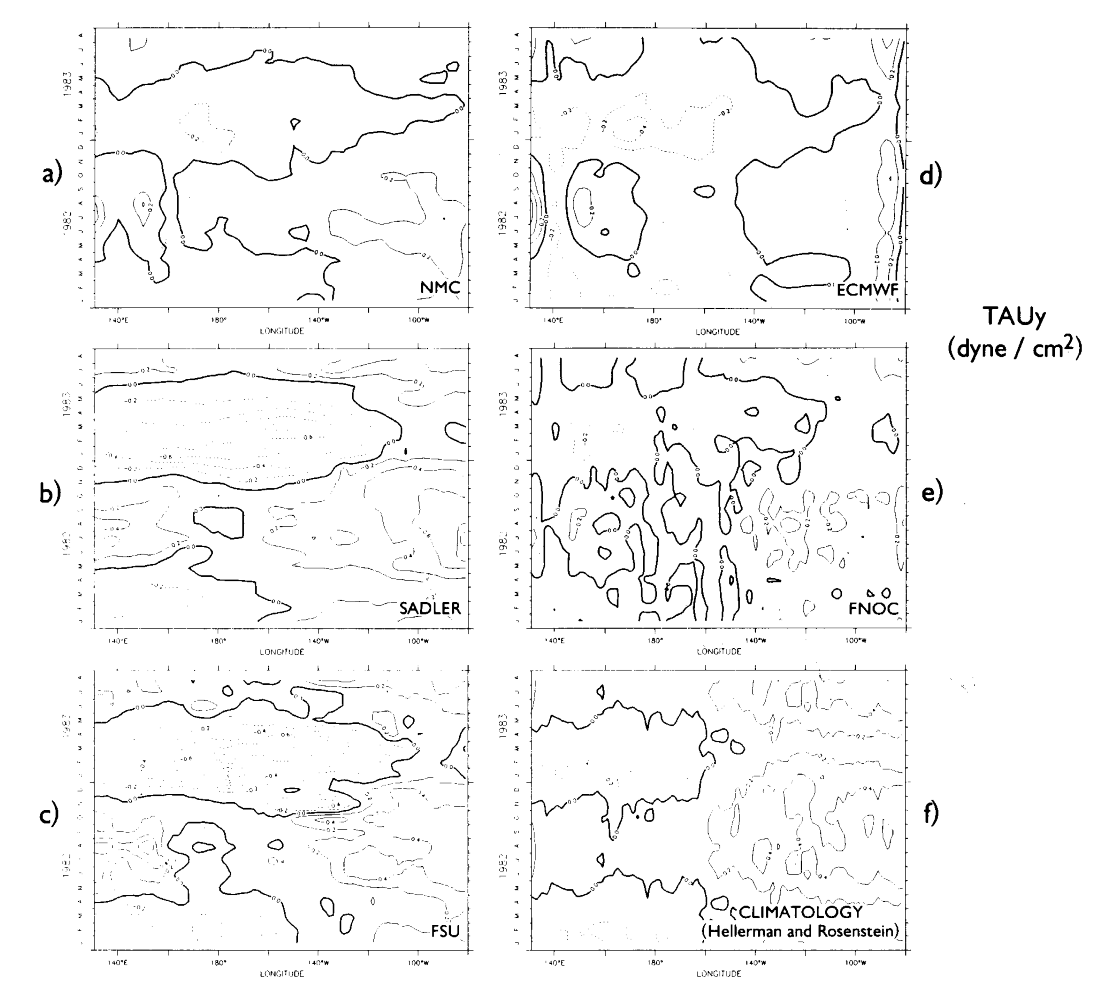
Figure 3. As for Figure 2, except meridional wind stress fields.
The zonal-stress plots (Fig. 2) very clearly
show that large zonal wind stress anomalies occurred in 1982-83, and that the
different analyses generally agree qualitatively on the nature of the ENSO signal:
westerly stress appeared in the western Pacific by mid-1982, ultimately extended
east of the date line and essentially disappeared in December 1982-January 1983
in the central Pacific; much weaker than normal stresses occurred across the
basin through early 1983; easterly stress returned to at least 0.02 N M by May-June 1983. Note, however, that the various analyses differ greatly in
the timing of the appearance of the westerlies, their magnitude, whether there
was slow eastward propagation or rather abrupt extension across many degrees
of longitude, and in the eastward extent of the westerlies. There are also major
differences in the far western Pacific in early 1982, in how the easterly trades
behaved east of 160°W in June-December 1982, and in how the climatological easterlies
reappeared in mid-1983. While qualitative agreement is considerable, quantative
differences are large.
by May-June 1983. Note, however, that the various analyses differ greatly in
the timing of the appearance of the westerlies, their magnitude, whether there
was slow eastward propagation or rather abrupt extension across many degrees
of longitude, and in the eastward extent of the westerlies. There are also major
differences in the far western Pacific in early 1982, in how the easterly trades
behaved east of 160°W in June-December 1982, and in how the climatological easterlies
reappeared in mid-1983. While qualitative agreement is considerable, quantative
differences are large.
The meridional stress plots (Fig. 3) again agree qualitatively that there was unusually strong southerly stress in the western Pacific in mid-1982 and unusually widespread northerly stress in December 1982-Spring 1983. As with the zonal stress comparison, large quantitative differences are found at various times, particularly in the magnitude of the "southerly" anomaly and of the "northerly" anomaly; differences in detail are widespread.
For the following discussion, the needed information can be obtained from Figs. 2 and 3; a more quantative comparison of the differences between the products can be found in Harrison et al. (1988).
Go back to previous section or forward to next section