
U.S. Dept. of Commerce / NOAA/ OAR / PMEL / Publications
What do we know about how tropical Pacific SST changed during 1982-83? Fields of monthly mean SST have been obtained from Fleet Numerical Ocean Central ("spot obs", made available to us by Scott Woodruff), the NASA THEP (TOGA Heat Exchange Project) fields (made available by Tim Liu), and the NOAA Climate Analysis Center (CAC) "in situ" and "blended" analyses (made available by Dick Reynolds). The FNOC and NMC "in situ" fields were based primarily on surface marine observations, while the NMC "blend" product made considerable use of satellite (MCSST) SST spatial gradient information, together with surface data. The THEP product was based primarily on satellite (SMMR) data. The large-scale pattern of SST evolution during 1982-83, according to the NMC "blend" analysis, has been presented in a number of places (e.g., Rasmusson and Wallace 1983), and is assumed to be familiar to the reader. This event differed from the composite post-1950 ENSO event described by Rasmusson and Carpenter (1982) in several respects: there was no significant warming along the South American coast in Spring 1982; the first substantial warming occurred along the equator in late Summer 1982; substantial warm anomalies appeared along the South American coast late in 1982, and the midocean remained significantly warmer than usual into late Spring 1983. Our interest is to understand the mechanisms responsible for these changes.
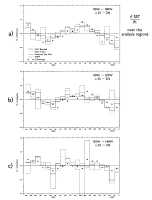
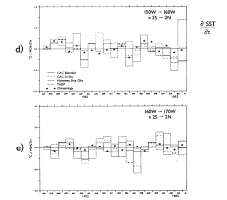
The heat equation relates the time rate of change of SST to the various advective, diffusive and forcing processes, so it is necessary to concentrate not on the patterns of SST, but of SST change from month to month. In order to limit this discussion, the equatorial Pacific has been divided into five regions, each extending from 2°N to 2°S, and across 10 degrees of longitude in zonal extent. Region center longitudes are 95°W, 115°W, 135°W, 155°W and 165°E. Forward time differences of SST from each SST dataset averaged over each region are displayed in Fig. 1(a-c; d and e); climatological SST changes, based on the post-1950 surface marine data, are also included for reference.
Figure 1. Monthly average rates of change of SST for the five analysis regions, according to the NMC "in situ," NMC "blend," FNOC spot obs, and NASA THEP SST datasets (see text for more information on these SST fields, and for discussion). Note that the different fields generally differ on the sign of the month-to-month change, except when the rate of change exceeds roughly 1 degree C per month.
In the 95°W region the climatological cycle of cooling between March and September, followed by warming between October and February, is followed roughly during 1982; there is less cooling in May, July and August 1982 than is inicated in the climatology, and there is warming instead of cooling in September 1982. Nineteen hundred and eighty-three was also similar in pattern to climatology until July, when much stronger than normal cooling took place; this cooling was sufficiently strong to bring SST values back to normal. These is consensus among the SST datasets that cooling took place in March, May and June 1982 and April, June and July 1983; there is consensus that warming took place between October 1982 and March 1983.
In the 115°W region, where there are fewer surface observations, the pattern of cooling and warming is similar to that in the 95°W region, but with more month-to-month variability and generally with smaller values. The climatological cycle is also noisier than at 95°W. The strongest warming that is agreed upon occurs in September 1982; the strongest cooling was in May and June 1983. Both are sharp departures from climatological behavior. These departures are consistent with the near surface 110°W mooring data reported by Halpern (1987).
At 135°W the normal seasonal cycle pattern roughly holds until around late August 1982 when there is arguably a two month period of substantial warming. (Two of the analyses show very anomalous August 1982 warming, while the others show no temperature change; all show subsequent warming.) There follow many months of uncertain temperature tendency, until in June-July 1983 there is agreement that the ocean cooled much more strongly than indicated by climatology. Averaged over the period August-November 1982 there is consensus that warming took place. No moored or other densely sampled dataset is available for comparison in this region for this period.
At 155°W there is agreement that there was modest warming in February-May and late July 1982, and cooling in late June. There is no consistent month-to-month pattern or agreement between August 1982 and February 1983, but the average over August-November 1982 is for warming in each analysis. There is consensus that warming took place in late February, early March 1983, and cooling in June-July 1983. The agreed upon substantial departures from climatological behavior are the cooling in late June 1982 and late June 1983; the late July 1982 warming represents less than a 1°C/mo departure.
At 165°E the best agreement is March-April 1982 (warming) followed by a tendency toward cooling. There is little agreement again until late January, early February 1983 (cooling). These patterns are consistent with those reported by Meyers et al. (1986), based on XBT data. The climatological cycle of SST change never involves changes greater than 0.5°C/mo, and contains much more semiannual variability than annual variability. It is difficult to compare the 1982-83 data with the climatological cycle because the differences between the various versions of 1982-83 behavior are larger than the month-to-month climatological changes.
Note that in the easternmost two regions, the analyses generally agree on the sign of the derivative of SST whenever it exceeds 1°C/mo in at least one analysis. When it is smaller than 1°C/mo there may or may not be agreement on sign. In the regions farther west it is much harder to find even agreement on the sign of the time rate of change of SST from month to month. Also worthy of note is that the departures from climatological behavior tend to be smaller than the differences between the different SST datasets, even in a major ENSO event like 1982-83.
Clearly our knowledge of this most basic quantity for the diagnosis of SST change processes, which is fundamental to any model-data comparison of the 1982-83 ENSO, is marginal. Although the FNOC spot obs. dataset often shows the largest month-to-month jumps, careful examination of Fig. 1(a-c; d and e) will reveal that there is no consistent pattern of disagreement between SST datasets. Because of the eruption of El Chichon in the Spring of 1982, satellite SST retrieval algorithms had to be modified to account for the altered atmospheric aerosol loading; this may account for some of the scatter in the analyzed SST fields. But by 1983 these anomalies were of negligible concern. The continued disagreements between datasets suggest that the SST monitoring systems in place in 1982-83 were generally not able to agree unless the SST change signal is at least 1°C/mo. Even in this major ENSO event, analyzed SST changes in the equatorial Pacific (where the SST changes are larger than aywhere else in the mid-ocean) are seldom this large.
Go back to Introduction or forward to next section